OPEN-SOURCE SCRIPT
MARSI
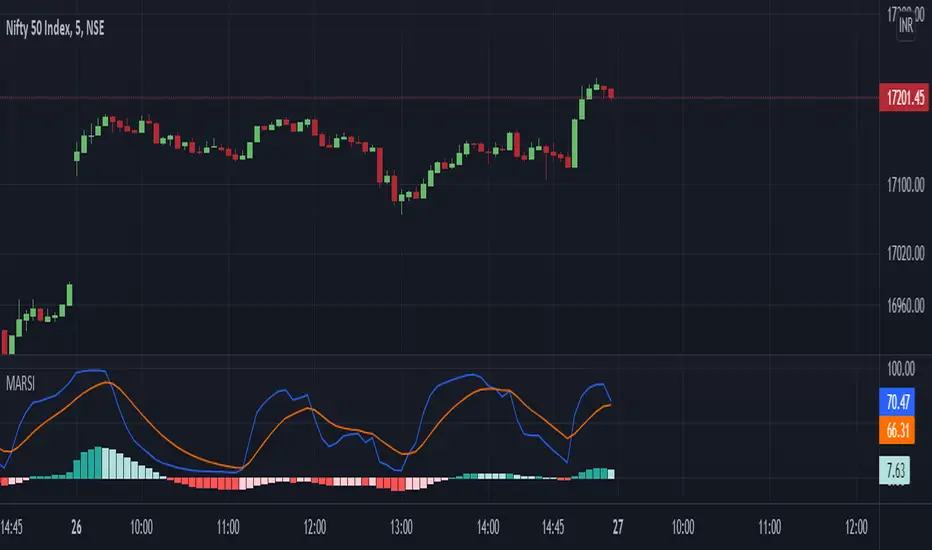
An advanced version of MACD and RSI combined, where moving averages gives quality early signals along with the strength of Histogram. This Version of MACD helps traders to understand strength in the Histogram and possibilities of a reversal. Indicator also gives Early Indications of trend shift.
MACD input options Given to User
The Indicator draws MACD and MACD Histogram
Based on histogram Value RSI is Plotted and RSI Based EMA is Plotted as MARSI line and Signal Line
Calculations :
MACD Line: (12-day EMA - 26-day EMA)
Signal Line: 9-day EMA of MACD Line
MACD Histogram: MACD Line - Signal Line
MARSI Line : RSI Value of MACD Histogram
Signal Line : 9-day EMA of Marsi Line
Skrypt open-source
W zgodzie z duchem TradingView twórca tego skryptu udostępnił go jako open-source, aby użytkownicy mogli przejrzeć i zweryfikować jego działanie. Ukłony dla autora. Korzystanie jest bezpłatne, jednak ponowna publikacja kodu podlega naszym Zasadom serwisu.
Wyłączenie odpowiedzialności
Informacje i publikacje nie stanowią i nie powinny być traktowane jako porady finansowe, inwestycyjne, tradingowe ani jakiekolwiek inne rekomendacje dostarczane lub zatwierdzone przez TradingView. Więcej informacji znajduje się w Warunkach użytkowania.