PROTECTED SOURCE SCRIPT
Hybrid Profile [DW]

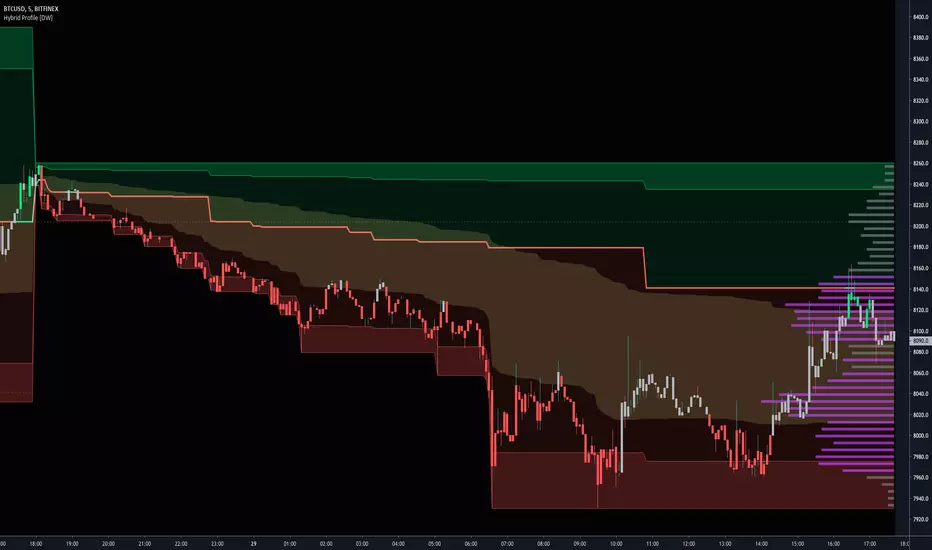
This is an experimental study inspired by J. Peter Steidlmayer's Market Profile tool with an alternative set of calculations for analyzing price action and distribution over a defined interval.
This tool is geared toward finding price reactive points for better entry and exit positions.
In this script, price range over a user defined interval (up to 4000 bars) is divided into 50 sections, then TPOs are counted for each section to generate the distribution histogram. Histogram lines are calculated in real time, and recalculate on each new bar.
Areas of significance are displayed as purple lines in the histogram, making it incredibly simple to identify levels that price will likely react to. The significance sensitivity can be manually adjusted for desired output.
Rather than using POC, I created a series of proprietary calculations to generate what I call the Point Of Focus (POF). This line is similar to POC, but does not always follow the highest count in the distribution.
The POF is designed to experience less whipsaws than POC, which makes trading using the POF much simpler since its value is more consistent. On historical data, price has shown to either revert to or launch from the POF rather frequently.
Unlike a conventional Market Profile, this profile doesn't have a "value area". Instead it has a Mean Value Zone, which is calculated using a series of custom VWAP calculations. The output is similar to VA, but much smoother.
This script has a built in tick volume substitution for charts with no real volume data, making all elements of the script compatible with any cryptocurrency, stock, currency pair, or index you want to analyze.
A bar color scheme is included within this script which can be used to help determine dominant trend and local extremes of the interval.
This tool is not necessarily better or worse than the classic Market Profile, nor is it a replacement for Volume Profile.
However, this is a powerful alternative that can both simplify and improve your technical analysis.
Skrypt chroniony
Ten skrypt został opublikowany jako zamknięty kod źródłowy. Można z tego korzystać swobodnie i bez żadnych ograniczeń — więcej informacji znajduje się tutaj.
For my full list of premium tools, check the blog:
wallanalytics.com/
Reach out on Telegram:
t.me/DonovanWall
wallanalytics.com/
Reach out on Telegram:
t.me/DonovanWall
Wyłączenie odpowiedzialności
Informacje i publikacje nie stanowią i nie powinny być traktowane jako porady finansowe, inwestycyjne, tradingowe ani jakiekolwiek inne rekomendacje dostarczane lub zatwierdzone przez TradingView. Więcej informacji znajduje się w Warunkach użytkowania.