OPEN-SOURCE SCRIPT
Zaktualizowano Fukuiz Trend
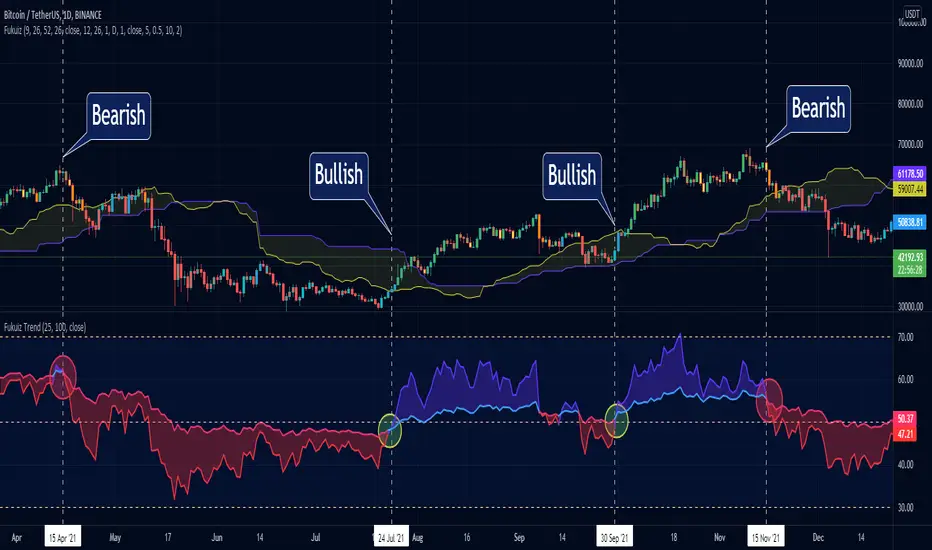
This indicator base on RSI of 2 different periond.
#A brief introduction to RSI #
The relative strength index (RSI) is a momentum indicator used in technical analysis that measures the magnitude of recent price changes to evaluate overbought or oversold conditions in the price of a stock or other asset. The RSI is displayed as an oscillator (a line graph that moves between two extremes) and can have a reading from 0 to 100. The indicator was originally developed by J. Welles Wilder Jr. and introduced in his seminal 1978 book, “New Concepts in Technical Trading Systems.”
Traditional interpretation and usage of the RSI are that values of 70 or above indicate that a security is becoming overbought or overvalued and may be primed for a trend reversal or corrective pullback in price. An RSI reading of 30 or below indicates an oversold or undervalued condition.
#In this indicator#
I see that you can use 2 RSI with different periond to suggest Bullish trend and Bearish trend.
#Conditions between short and long RSI crossing#
Crossover = Bullish trend (blue zone)
Crossunder = Bearish trend (red zone)
Informacje o Wersji
Minor fixInformacje o Wersji
Update-Add Bullish/Bearish Divergence Signal.
Informacje o Wersji
:Update-Convert Pine Script to V.5
-Edit Default Setting
Skrypt open-source
W duchu TradingView twórca tego skryptu udostępnił go jako open-source, aby traderzy mogli analizować i weryfikować jego funkcjonalność. Brawo dla autora! Możesz korzystać z niego za darmo, ale pamiętaj, że ponowna publikacja kodu podlega naszym Zasadom Społeczności.
Wyłączenie odpowiedzialności
Informacje i publikacje przygotowane przez TradingView lub jego użytkowników, prezentowane na tej stronie, nie stanowią rekomendacji ani porad handlowych, inwestycyjnych i finansowych i nie powinny być w ten sposób traktowane ani wykorzystywane. Więcej informacji na ten temat znajdziesz w naszym Regulaminie.