OPEN-SOURCE SCRIPT
QQE
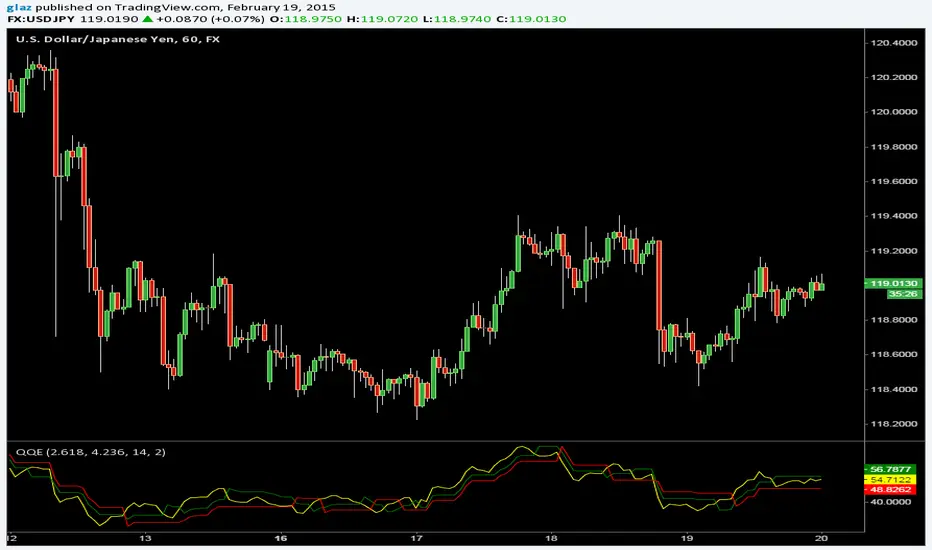
The Metastock version of Quantative Qualitative Estimation with two trailing stop lines and more options
Yellow line can be hidden if its too many signals and expirement with the Slow/Fast Trailing stop lines.
Yellow line can be hidden if its too many signals and expirement with the Slow/Fast Trailing stop lines.
Skrypt open-source
W zgodzie z duchem TradingView twórca tego skryptu udostępnił go jako open-source, aby użytkownicy mogli przejrzeć i zweryfikować jego działanie. Ukłony dla autora. Korzystanie jest bezpłatne, jednak ponowna publikacja kodu podlega naszym Zasadom serwisu.
Wyłączenie odpowiedzialności
Informacje i publikacje nie stanowią i nie powinny być traktowane jako porady finansowe, inwestycyjne, tradingowe ani jakiekolwiek inne rekomendacje dostarczane lub zatwierdzone przez TradingView. Więcej informacji znajduje się w Warunkach użytkowania.