PROTECTED SOURCE SCRIPT
Alt Chart Divergence
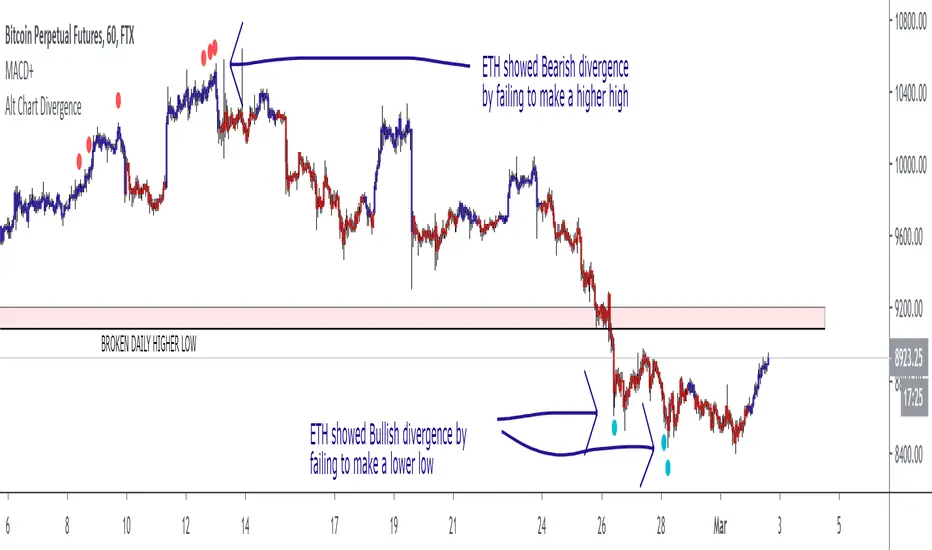
This script is designed to allow you to view bullish or bearish divergences between Bitcoin and ETH or an other alt of choice. However, you could also apply the idea in reverse or use it to look at chart comparisons such as DJI vs SPX or XAU vs XAG or UKOIL vs USOIL. Any alternate ticker can be used to plot divergences on the primary ticker treating the alternate chart as an indicator.
The design is very simple, just showing a dot for each case of bullish or bearish divergence.
The design is very simple, just showing a dot for each case of bullish or bearish divergence.
Skrypt chroniony
Ten skrypt został opublikowany jako zamknięty kod źródłowy. Można z tego korzystać swobodnie i bez żadnych ograniczeń — więcej informacji znajduje się tutaj.
Wyłączenie odpowiedzialności
Informacje i publikacje nie stanowią i nie powinny być traktowane jako porady finansowe, inwestycyjne, tradingowe ani jakiekolwiek inne rekomendacje dostarczane lub zatwierdzone przez TradingView. Więcej informacji znajduje się w Warunkach użytkowania.