OPEN-SOURCE SCRIPT
Zaktualizowano Relative Strength Matrix
The Relative Strength Matrix (RSPS M) is a powerful comparison tool that analyzes and ranks up to 10 selected assets based on their relative performance. It does this by calculating price ratios between all asset pairs and applying a consistent strength criterion across each comparison. The results are displayed in a live-updating matrix, showing how each asset performs relative to the rest of the group.
By default, the indicator uses a momentum-based approach (via RSI) to evaluate strength, but it’s fully customizable. Users can modify the valuation logic by replacing the built-in ta.rsi function under the “Inputs your criterion below” section in the code. This makes the tool highly flexible—allowing for different styles of comparison such as trend-following, volatility-adjusted, or custom factor-based ranking methods.
Each asset’s total dominance score is color-coded and ranked, making it easy to spot outperformers and underperformers within any chosen basket. Whether you're tracking crypto pairs, sectors, or other groups, RSPS M provides a clear, objective framework for relative strength monitoring and rotation strategies—perfect for spotting leaders, laggards, and shifts in momentum across markets.
Informacje o Wersji
The Relative Strength Matrix (RSPS M) is a powerful comparison tool that analyzes and ranks up to 10 selected assets based on their relative performance. It does this by calculating price ratios between all asset pairs and applying a consistent strength criterion across each comparison. The results are displayed in a live-updating matrix, showing how each asset performs relative to the rest of the group.By default, the indicator uses a momentum-based approach (via RSI) to evaluate strength, but it’s fully customizable. Users can modify the valuation logic by replacing the built-in ta.rsi function under the “Inputs your criterion below” section in the code (line 148). This makes the tool highly flexible—allowing for different styles of comparison such as trend-following, volatility-adjusted, or custom factor-based ranking methods.
Each asset’s total dominance score is color-coded and ranked, making it easy to spot outperformers and underperformers within any chosen basket. Whether you're tracking crypto pairs, sectors, or other groups, RSPS M provides a clear, objective framework for relative strength monitoring and rotation strategies—perfect for spotting leaders, laggards, and shifts in momentum across markets.
Informacje o Wersji
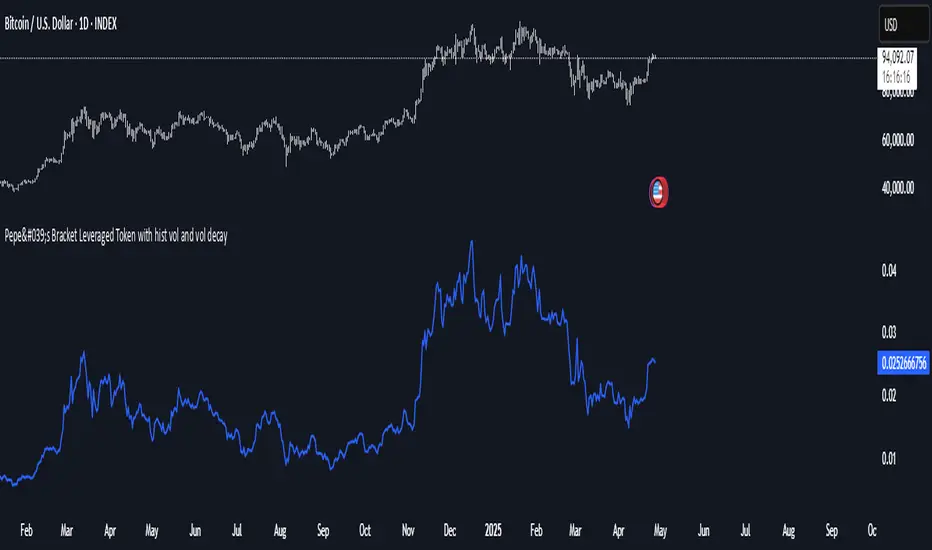
Updated imageInformacje o Wersji
Made some changes so you can actually see the historical selection of the indicator and made the table/matrix more compact by removing "USD" or "USDT" and only using one digit after "."Again feel free to input your own criterion.
Enjoy.
Informacje o Wersji
Updated visuals Informacje o Wersji
Updated visuals Informacje o Wersji
I dont know Informacje o Wersji
Updating Skrypt open-source
W zgodzie z duchem TradingView twórca tego skryptu udostępnił go jako open-source, aby użytkownicy mogli przejrzeć i zweryfikować jego działanie. Ukłony dla autora. Korzystanie jest bezpłatne, jednak ponowna publikacja kodu podlega naszym Zasadom serwisu.
Wyłączenie odpowiedzialności
Informacje i publikacje nie stanowią i nie powinny być traktowane jako porady finansowe, inwestycyjne, tradingowe ani jakiekolwiek inne rekomendacje dostarczane lub zatwierdzone przez TradingView. Więcej informacji znajduje się w Warunkach użytkowania.
Skrypt open-source
W zgodzie z duchem TradingView twórca tego skryptu udostępnił go jako open-source, aby użytkownicy mogli przejrzeć i zweryfikować jego działanie. Ukłony dla autora. Korzystanie jest bezpłatne, jednak ponowna publikacja kodu podlega naszym Zasadom serwisu.
Wyłączenie odpowiedzialności
Informacje i publikacje nie stanowią i nie powinny być traktowane jako porady finansowe, inwestycyjne, tradingowe ani jakiekolwiek inne rekomendacje dostarczane lub zatwierdzone przez TradingView. Więcej informacji znajduje się w Warunkach użytkowania.