OPEN-SOURCE SCRIPT
OpenCipher A
OpenCipher A is an open-source and free to use Overlay.
Features:
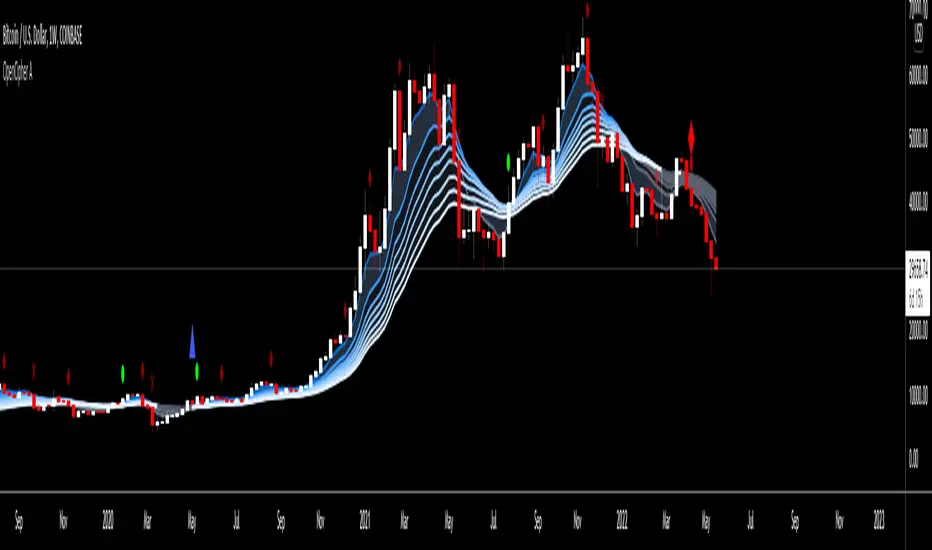
EMA Ribbons
The EMA RIbbons are a set of exponential moving averages. Blue and white ribbons = uptrend, gray ribbons = downtrend. The ribbons can act as support in uptrends and as resistance in downtrends.
Lengths and source of the ribbons are customizable.
Symbols
Usage
Treat the symbols as signs that your attention might be required and don't trade based on them.
Features:
- EMA Ribbons (Lengths: 5, 11, 15, 18, 21, 25, 29, 33)
- Symbols ("Be careful" and "attention required" signals)
EMA Ribbons
The EMA RIbbons are a set of exponential moving averages. Blue and white ribbons = uptrend, gray ribbons = downtrend. The ribbons can act as support in uptrends and as resistance in downtrends.
Lengths and source of the ribbons are customizable.
Symbols
- Green Dots: The green dot is a bullish symbol that appears whenever the EMA 11 crosses over EMA 33.
- Red Cross: The red cross is a bearish symbol that appears whenever the EMA 5 crosses under EMA 11.
- Blue Triangle: The blue triangle marks a possible trend reversal that appears whenever the EMA 5 crosses over EMA 25 while EMA 29 is below EMA 33.
- Red Diamond: The red diamond is a bearish symbol that marks a potential local top whenever a bearish wavecross occurs (fast wave crosses under slow wave).
- Yellow X: The yellow X is a warning signal that appears whenever a bearish wavecross occurs while the slow wave of the wavetrend is below -40 and the moneyflow is in the red (below zero).
- Blood Diamond: The blood diamond is a bearish symbol that highlights whenever the red diamond and the red cross appear on the same candle.
Usage
Treat the symbols as signs that your attention might be required and don't trade based on them.
Skrypt open-source
W prawdziwym duchu TradingView autor tego skryptu opublikował go jako open source, aby inwestorzy mogli go zrozumieć i zweryfikować. Pozdrowienia dla autora! Możesz go używać bezpłatnie, ale ponowne użycie tego kodu w publikacji podlega Zasadom Regulaminu. Możesz go oznaczyć jako ulubione, aby użyć go na wykresie.
Wyłączenie odpowiedzialności
Informacje i publikacje przygotowane przez TradingView lub jego użytkowników, prezentowane na tej stronie, nie stanowią rekomendacji ani porad handlowych, inwestycyjnych i finansowych i nie powinny być w ten sposób traktowane ani wykorzystywane. Więcej informacji na ten temat znajdziesz w naszym Regulaminie.