PROTECTED SOURCE SCRIPT
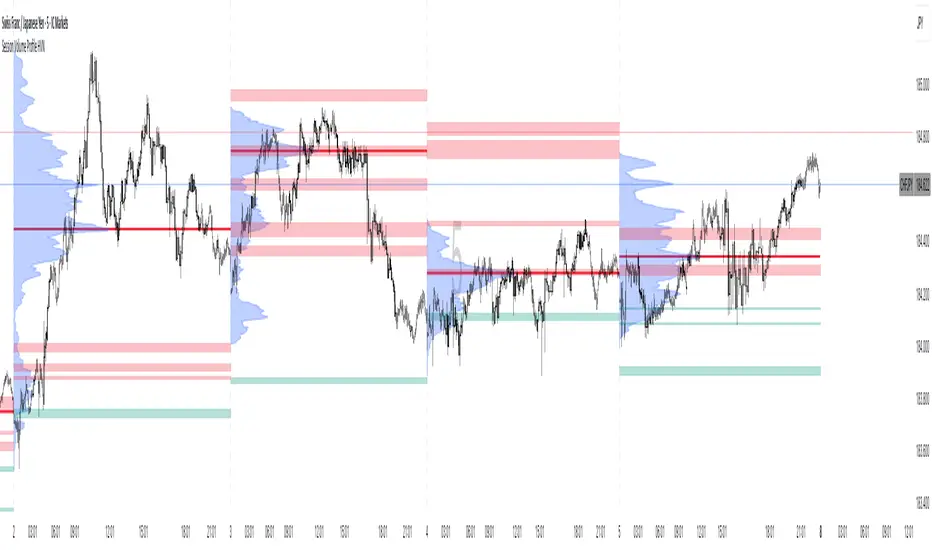
Session Volume Profile HVN
Session Volume Profile HVN - Comprehensive Indicator Description
Overview
The Session Volume Profile HVN is an advanced volume analysis indicator that provides traders with a visual representation of volume distribution across price levels within defined trading sessions. This powerful tool combines traditional volume profile analysis with High Volume Node (HVN) detection and Volume Point of Control (VPOC) tracking to help identify key support and resistance areas based on trading activity.
Key Features
1. Dynamic Volume Profile Visualization
Creates a comprehensive volume profile for each trading session (daily, weekly, or custom timeframes)
Displays volume distribution as a horizontal histogram, showing where the most trading activity occurred
Automatically scales to fit the price range of each session
Customizable number of price levels (rows) for granular or broad analysis
Profile extension capability to project volume areas into subsequent sessions
2. Volume Point of Control (VPOC)
Automatically identifies and marks the price level with the highest volume in each session
Displays VPOC as a prominent horizontal line that can extend into future sessions
Tracks multiple historical VPOCs with customizable extension limits
Optional date labels for easy identification of when each VPOC was formed
Particularly useful for identifying potential support/resistance levels based on peak trading activity
3. High Volume Node (HVN) Detection
Sophisticated algorithm that identifies significant volume clusters within the profile
Validates HVNs based on customizable strength criteria
Two display options:
Levels: Shows HVNs as horizontal lines (solid for VPOC, dotted for other nodes)
Areas: Displays HVNs as shaded boxes covering the full price range of the node
Color-coded based on price position relative to previous close:
Bullish color for HVNs below the previous close (potential support)
Bearish color for HVNs above the previous close (potential resistance)
4. Multi-Timeframe Analysis
Profile Timeframe: Defines the session boundaries (e.g., daily, weekly, monthly)
Resolution Timeframe: Uses lower timeframe data for more accurate volume distribution
Automatically adjusts to ensure compatibility with chart timeframe
Enables precise volume analysis even on higher timeframe charts
Practical Applications
Support and Resistance Identification
VPOCs and HVNs often act as significant support/resistance levels
Multiple confluent HVNs can indicate strong price zones
Historical VPOC levels provide context for potential price reactions
Trading Strategy Development
Entry/exit points near HVN boundaries
Stop loss placement beyond significant volume nodes
Trend continuation or reversal signals when price breaks through HVN areas
Market Structure Analysis
Identify accumulation/distribution zones
Recognize price acceptance or rejection at specific levels
Understand market participant behavior through volume concentration
Customization Options
Visual Settings
Adjustable colors for profile, VPOC lines, and HVN areas
Line width controls for better visibility
Label size options from tiny to huge
Profile transparency for chart clarity
Technical Parameters
Number of price levels (rows) for profile resolution
HVN detection strength for sensitivity adjustment
VPOC extension count for historical reference
Profile extension percentage for future projection
Display Preferences
Toggle VPOC visibility
Enable/disable HVN display
Choose between line or area representation for HVNs
Control date label display based on timeframe
Best Practices
Timeframe Selection: Choose profile timeframes that align with your trading style (day traders might use hourly profiles, swing traders daily or weekly)
HVN Strength Calibration: Adjust the HVN strength parameter based on market volatility and desired sensitivity
Multiple Timeframe Confirmation: Use different profile timeframes to identify confluence zones
Combination with Other Indicators: Enhance analysis by combining with trend indicators, momentum oscillators, or price action patterns
Performance Considerations
The indicator is optimized for smooth performance while maintaining accuracy through:
Efficient data processing algorithms
Smart memory management for historical data
Automatic cleanup of old visual elements
Scalable architecture supporting up to 500 visual elements
Ideal For
Day Traders: Identifying intraday support/resistance levels
Swing Traders: Finding multi-day accumulation zones
Position Traders: Analyzing longer-term volume structures
Market Analysts: Understanding market participant behavior
Algorithmic Traders: Incorporating volume-based levels into automated strategies
Skrypt chroniony
Ten skrypt został opublikowany jako zamknięty kod źródłowy. Możesz jednak używać go swobodnie i bez żadnych ograniczeń – więcej informacji tutaj.
Wyłączenie odpowiedzialności
Informacje i publikacje przygotowane przez TradingView lub jego użytkowników, prezentowane na tej stronie, nie stanowią rekomendacji ani porad handlowych, inwestycyjnych i finansowych i nie powinny być w ten sposób traktowane ani wykorzystywane. Więcej informacji na ten temat znajdziesz w naszym Regulaminie.