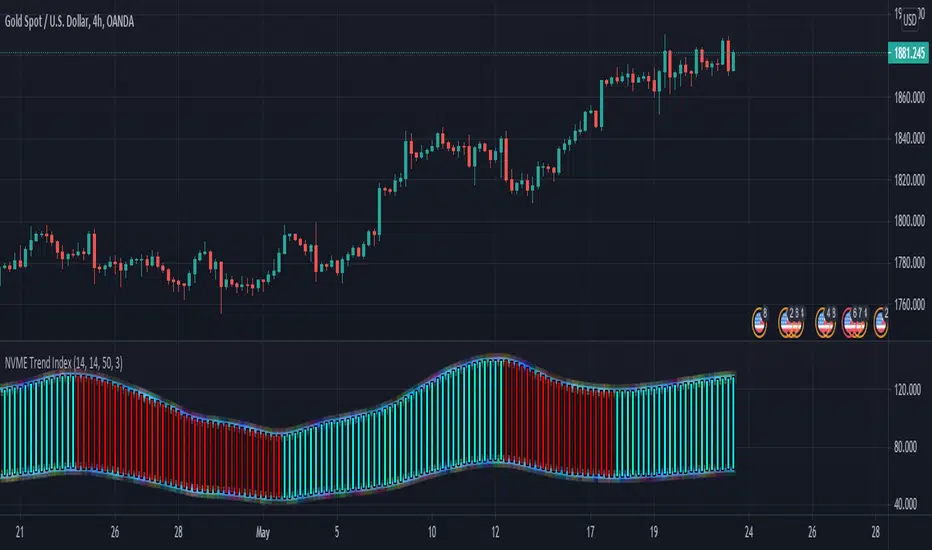
NVME Trend Index

There are only 4 settings to play around with, this is one of our most simplest indicators to use yet.
Setting 1: Index Length [5-30]: This is a number-based input field that has the minimum value of 5 and maximum value of 30, changing the number inside of here will change how fast / slow the bars will switch trends and this also impacts the values of the column's top and bottom.
Setting 2: Reactivity [1-200]: This is another number-based input field that has the minimum value of 1 and the maximum value of 200, changing the number inside of here will add towards how fast / slow the bars will switch trends and the lower it is the faster it is, but this will contain some false columns, increasing it will delay the trend switch however remove most false columns.
Setting 3: Trend Scalar [10-500]: This is another number-based input field that has the minimum value of 10 and the maximum value of 500, changing the number inside of here will impact all of the indicator and the modified linear regression. This will result in smaller or larger columns, faster or slower trend reactions.
Setting 4: Trend Offset [1-20]: This is the modifier for the trend scalar and this will impact its effectiveness at providing faster / slower trend switches.
This indicator is best combined with NVME Vanquisher X Algorithm, support and resistance analysis or your trading style and our NVME Trend Meter X. Though you could use this, enable the trend cloud feature on NVME Vanquisher and use the calls made.
This script comes with all NVME Scripts.
Skrypt tylko na zaproszenie
Dostęp do tego skryptu mają wyłącznie użytkownicy zatwierdzeni przez autora. Aby z niego korzystać, należy poprosić o zgodę i ją uzyskać. Zgoda jest zazwyczaj udzielana po dokonaniu płatności. Więcej informacji można znaleźć w instrukcjach autora poniżej lub kontaktując się bezpośrednio z Crypto_Samm.
TradingView NIE zaleca płacenia za skrypt ani korzystania z niego, jeśli nie ma pełnego zaufania do jego autora i nie rozumie się zasad jego działania. Można również znaleźć darmowe, otwartoźródłowe alternatywy w skryptach społeczności.
Instrukcje autora
You can also find videos, images, documentation and other resources there too.
Join Our Discord: discord.gg/2CY7BYTySR
Wyłączenie odpowiedzialności
Skrypt tylko na zaproszenie
Dostęp do tego skryptu mają wyłącznie użytkownicy zatwierdzeni przez autora. Aby z niego korzystać, należy poprosić o zgodę i ją uzyskać. Zgoda jest zazwyczaj udzielana po dokonaniu płatności. Więcej informacji można znaleźć w instrukcjach autora poniżej lub kontaktując się bezpośrednio z Crypto_Samm.
TradingView NIE zaleca płacenia za skrypt ani korzystania z niego, jeśli nie ma pełnego zaufania do jego autora i nie rozumie się zasad jego działania. Można również znaleźć darmowe, otwartoźródłowe alternatywy w skryptach społeczności.
Instrukcje autora
You can also find videos, images, documentation and other resources there too.
Join Our Discord: discord.gg/2CY7BYTySR