OPEN-SOURCE SCRIPT
52-Week & 5-Year High/Low with Dates
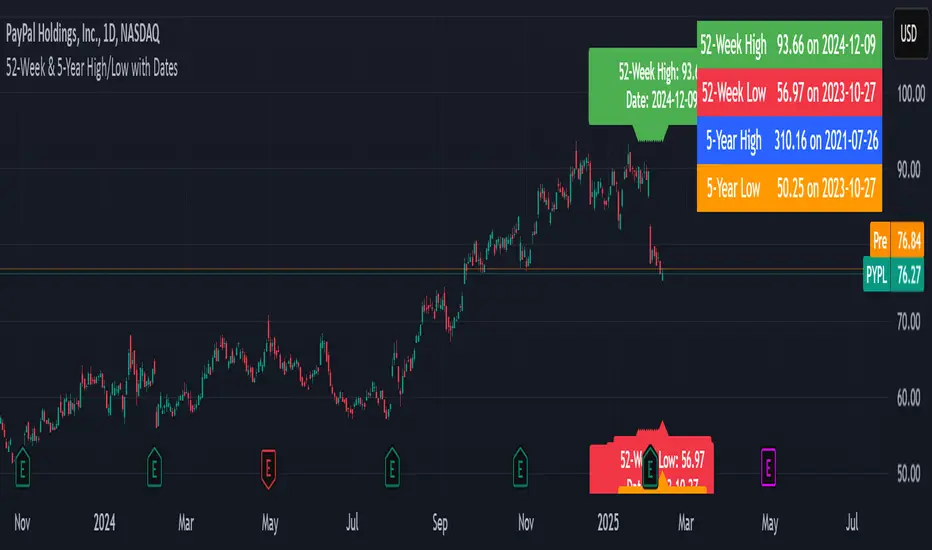
This indicator is designed to help traders quickly identify key price levels and their historical context by displaying the 52-week high/low and 5-year high/low prices along with their respective dates. It provides a clear visual representation of these levels directly on the chart and in a dashboard table for easy reference.
Key Features
52-Week High/Low:
Displays the highest and lowest prices over the last 252 trading days (approximately 52 weeks).
Includes the exact date when these levels were reached.
5-Year High/Low:
Displays the highest and lowest prices over the last 1260 trading days (approximately 5 years).
Includes the exact date when these levels were reached.
Visual Labels:
High and low levels are marked on the chart with labels that include the price and date.
Dashboard Table:
A table in the top-right corner of the chart summarizes the 52-week and 5-year high/low prices and their dates for quick reference.
Customizable Date Format:
Dates are displayed in the YYYY-MM-DD format for clarity and consistency.
Skrypt open-source
W zgodzie z duchem TradingView twórca tego skryptu udostępnił go jako open-source, aby użytkownicy mogli przejrzeć i zweryfikować jego działanie. Ukłony dla autora. Korzystanie jest bezpłatne, jednak ponowna publikacja kodu podlega naszym Zasadom serwisu.
Wyłączenie odpowiedzialności
Informacje i publikacje nie stanowią i nie powinny być traktowane jako porady finansowe, inwestycyjne, tradingowe ani jakiekolwiek inne rekomendacje dostarczane lub zatwierdzone przez TradingView. Więcej informacji znajduje się w Warunkach użytkowania.