PROTECTED SOURCE SCRIPT
Nexus v29 - Visual Remaster- The Unified Physics Engine
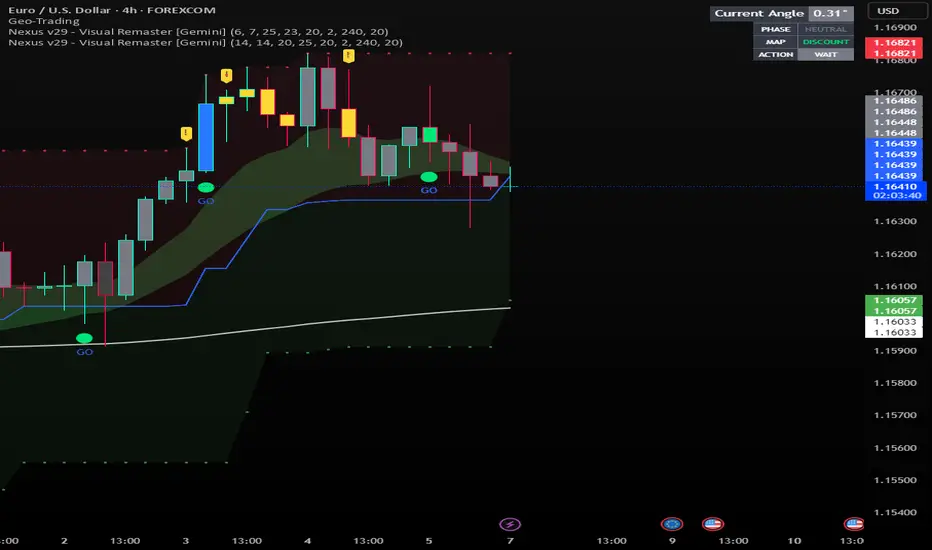
Title: Nexus v29 - Visual Remaster :The Unified Physics Engine
Description:
The Physics of Price Movement
Most indicators fail because they look at only one dimension of the market. They might show you price direction (RSI) or activity (Volume), but they rarely tell you if the move has actual power behind it.
Nexus v29 is built on a "Unified Physics" philosophy. Just as an object in the physical world needs Mass, Acceleration, and Energy to move effectively, a price trend needs Volume, Force, and Trend Strength to sustain a run.
This indicator visualizes the "Life Cycle" of a trend, filtering out the noise (churn) to highlight only the high-probability explosion points where physics aligns in your favor.
How It Works: The 3 Components
1. The Energy (ADX Filter)
The White Line: This is your master switch. It measures the total energy in the system.
The Logic: When the white line is below the threshold (25), the market is in a "Dead Zone." No matter how good the candle looks, there is no kinetic energy to sustain a move. We stay flat.
The Signal: When the line crosses above 25, the engine is on.
2. The Mass (Volume Fuel)
The Background Bars: These represent the market participation.
Grey Bars: Wasted fuel. High volume in a low-energy market is just churn/absorption.
Silver/Blue Bars: Active fuel. Volume that is successfully converting into price movement.
3. The Vector (Force Histogram)
The Colored Bars: This represents the immediate directional force (Momentum).
Lime Green: Explosion. Price is pushing up, Volume is supporting it, and ADX confirms the energy. This is a valid Long environment.
Red: Crash. Price is pushing down with supported volume and high energy. This is a valid Short environment.
Orange/Maroon: Fakeout/Churn. Divergences where price and volume disagree.
The "Equation" Strategy
This script is not just a visualizer; it implements a strict "Physics Equation" to filter trades. A signal is only valid if ALL of the following conditions are met simultaneously:
Trend Alignment: Price must be on the correct side of the 200 SMA (Long > 200, Short < 200).
Volatility Gate: The market must be expanding (ATR > Baseline).
Force Threshold: The momentum impulse must be significant (Force Histogram > 100), ensuring we are catching a runaway train, not a bicycle.
Active Energy: ADX must be > 25.
How to Trade It
Entry: Wait for a Lime Green (Long) or Red (Short) bar that breaks out while the White Line (ADX) is rising. This confirms "Unified Physics"—Mass, Force, and Energy are all aligned.
The Lifecycle Exit: Do not wait for the trend to reverse. Exit when the "physics" break.
Look for the Force Histogram bars to start shrinking for 2 consecutive candles. This indicates momentum is fading (deceleration).
Exit immediately on the close of the second shrinking bar to capture the bulk of the impulsive move (The "Meat" of the trade) before the inevitable pullback.
Indicator Settings
RSI Length: Standard 14 (The Speed).
Volume Lookback: 100 (For relative scaling).
ADX Threshold: 25 (The "Go/No-Go" Line).
Trend Filter: 200 Period SMA.
Disclaimer: Trading involves high risk. This tool helps visualize market conditions based on historical physics but does not guarantee future performance. Always use proper risk management.
Skrypt chroniony
Ten skrypt został opublikowany jako zamknięty kod źródłowy. Można z tego korzystać swobodnie i bez żadnych ograniczeń — więcej informacji znajduje się tutaj.
"Need help with Pine Script or a custom indicator? Feel free to message me, I'd be happy to assist!
☕ Support my work: paypal.me/ramegy"
☕ Support my work: paypal.me/ramegy"
☕ Support my work: paypal.me/ramegy"
☕ Support my work: paypal.me/ramegy"
Wyłączenie odpowiedzialności
Informacje i publikacje nie stanowią i nie powinny być traktowane jako porady finansowe, inwestycyjne, tradingowe ani jakiekolwiek inne rekomendacje dostarczane lub zatwierdzone przez TradingView. Więcej informacji znajduje się w Warunkach użytkowania.