OPEN-SOURCE SCRIPT
Zaktualizowano DCA Cost Basis (with Lump Sum)
DCA Cost Basis (with Lump Sum) — Pine Script v6
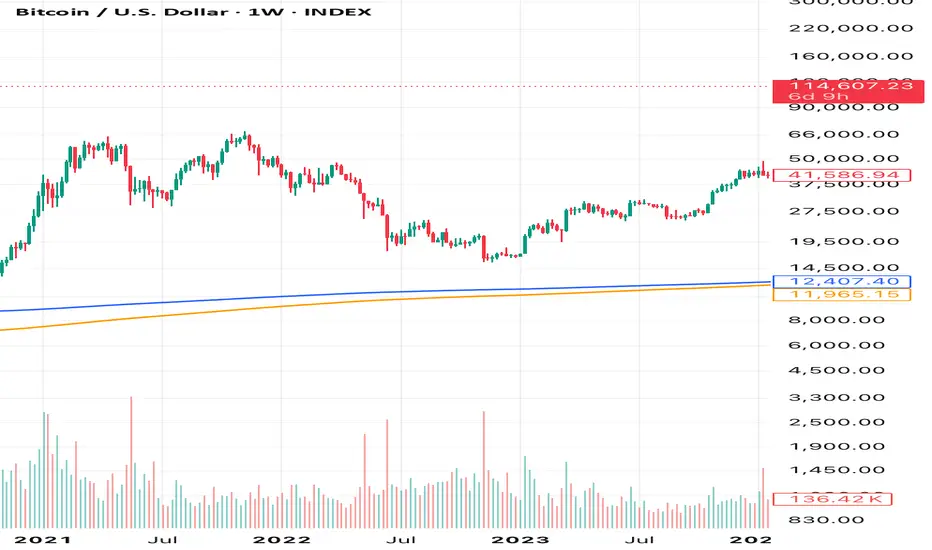
This indicator simulates a Dollar Cost Averaging (DCA) plan directly on your chart. Pick a start date, choose how often to buy (daily/weekly/monthly), set the per-buy amount, optionally add a one-time lump sum on the first date, and visualize your evolving average cost as a VWAP-style line.
[br][br]
Features
[br]
Why use it?
[br]
Note: This tool is for educational/simulation purposes. Results are based on bar closes and do not represent live orders or fees.
This indicator simulates a Dollar Cost Averaging (DCA) plan directly on your chart. Pick a start date, choose how often to buy (daily/weekly/monthly), set the per-buy amount, optionally add a one-time lump sum on the first date, and visualize your evolving average cost as a VWAP-style line.
[br][br]
Features
- Customizable DCA Plan — Set Start Date, buy Frequency (Daily / Weekly / Monthly), and Recurring Amount (in quote currency, e.g., USD).
- Lump Sum Option — Add a one-time lump sum on the very first eligible date; recurring DCA continues automatically after that.
- Cost Basis Line — Plots the live average price (Total Cost / Total Units) as a smooth, VWAP-style line for instant breakeven awareness.
- Buy Markers — Optional triangles below bars to show when simulated buys occur.
- Performance Metrics — Tracks:
Total Invested (quote)
Total Units (base)
Cost Basis (avg entry)
Current Value (mark-to-market)
CAGR (Annualized) from first buy to current bar - On-Chart Summary Table — Displays Start Date, Plan Type (Lump + DCA or DCA only), Total Invested, and CAGR (Annualized).
- Data Window Integration — All key values also appear in the Data Window for deeper inspection.
[br]
Why use it?
- Visualize long-term strategies for Bitcoin, crypto, or stocks.
- See how a lump sum affects your average entry over time.
- Gauge breakeven at a glance and evaluate historical performance.
[br]
Note: This tool is for educational/simulation purposes. Results are based on bar closes and do not represent live orders or fees.
Informacje o Wersji
DCA Cost Basis (with Lump Sum) — Pine Script v6Update 15/09/2025: Bug fixes.
This indicator simulates a Dollar Cost Averaging (DCA) plan directly on your chart. Pick a start date, choose how often to buy (daily/weekly/monthly), set the per-buy amount, optionally add a one-time lump sum on the first date, and visualize your evolving average cost as a VWAP-style line.
[br][br]
Features
- Customizable DCA Plan — Set Start Date, buy Frequency (Daily / Weekly / Monthly), and Recurring Amount (in quote currency, e.g., USD).
- Lump Sum Option — Add a one-time lump sum on the very first eligible date; recurring DCA continues automatically after that.
- Cost Basis Line — Plots the live average price (Total Cost / Total Units) as a smooth, VWAP-style line for instant breakeven awareness.
- Buy Markers — Optional triangles below bars to show when simulated buys occur.
- Performance Metrics — Tracks:
Total Invested (quote)
Total Units (base)
Cost Basis (avg entry)
Current Value (mark-to-market)
CAGR (Annualized) from first buy to current bar - On-Chart Summary Table — Displays Start Date, Plan Type (Lump + DCA or DCA only), Total Invested, and CAGR (Annualized).
- Data Window Integration — All key values also appear in the Data Window for deeper inspection.
[br]
Why use it?
- Visualize long-term strategies for Bitcoin, crypto, or stocks.
- See how a lump sum affects your average entry over time.
- Gauge breakeven at a glance and evaluate historical performance.
[br]
Note: This tool is for educational/simulation purposes. Results are based on bar closes and do not represent live orders or fees.
Skrypt open-source
W zgodzie z duchem TradingView twórca tego skryptu udostępnił go jako open-source, aby użytkownicy mogli przejrzeć i zweryfikować jego działanie. Ukłony dla autora. Korzystanie jest bezpłatne, jednak ponowna publikacja kodu podlega naszym Zasadom serwisu.
Wyłączenie odpowiedzialności
Informacje i publikacje nie stanowią i nie powinny być traktowane jako porady finansowe, inwestycyjne, tradingowe ani jakiekolwiek inne rekomendacje dostarczane lub zatwierdzone przez TradingView. Więcej informacji znajduje się w Warunkach użytkowania.