Chart Killer B
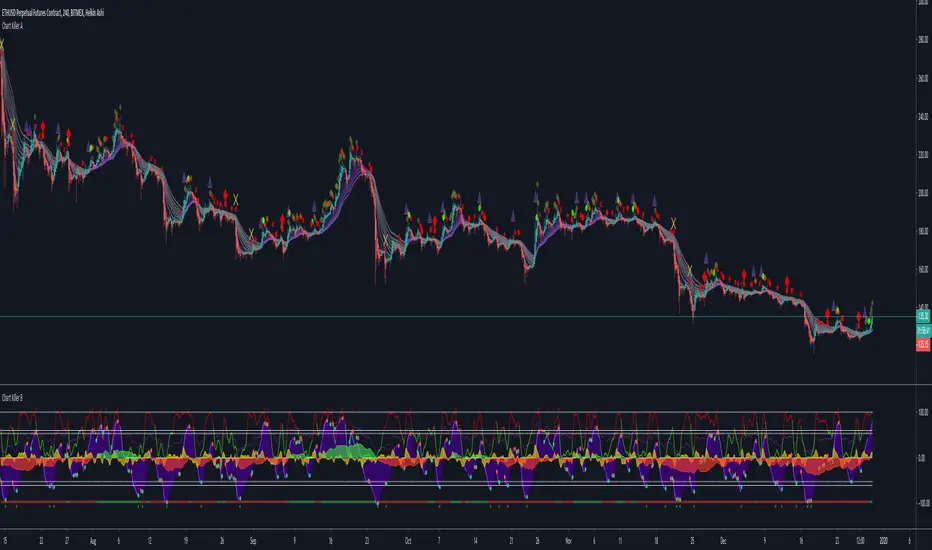
Primary Triggers:
Green Dots – Leading buy signals that excel in sideways and upward trends.
Red Dots – Leading sell signals that excel in sideways and downward trends.
Purple Waves – You are looking for overbought and oversold readings for the most part here, but to get the most out of these waves, learn how to spot divergent price action which often foreshadows a future price move.
Yellow VWAP – We have incorporated the VWAP into an oscillator. It is the easiest algorithm on B to read. When it crosses up, you are long until the next cross down. When it crosses down, you are short until the next cross up.
Secondary Triggers:
MFI – The custom Money Flow oscillator gives a great visual of market conditions. When it is green, we say the grass is growing, the Bulls are grazing, and the strategy is to buy dips. When the MFI is red, buyers are dead, and the prevailing strategy is to short the peaks. You can filter many bad trades by paying attention to the MFI.
RSI – The RSI misses many opportunities on its own, but when used in tandem the other oscillators in B, can provide an extra layer of confidence via overbought and oversold readings.
Skrypt tylko na zaproszenie
Dostęp do tego skryptu mają wyłącznie użytkownicy zatwierdzeni przez autora. Aby z niego korzystać, należy poprosić o zgodę i ją uzyskać. Zgoda jest zazwyczaj udzielana po dokonaniu płatności. Więcej informacji można znaleźć w instrukcjach autora poniżej lub kontaktując się bezpośrednio z FlipThatLot.
TradingView NIE zaleca płacenia za skrypt ani korzystania z niego, jeśli nie ma pełnego zaufania do jego autora i nie rozumie się zasad jego działania. Można również znaleźć darmowe, otwartoźródłowe alternatywy w skryptach społeczności.
Instrukcje autora
Wyłączenie odpowiedzialności
Skrypt tylko na zaproszenie
Dostęp do tego skryptu mają wyłącznie użytkownicy zatwierdzeni przez autora. Aby z niego korzystać, należy poprosić o zgodę i ją uzyskać. Zgoda jest zazwyczaj udzielana po dokonaniu płatności. Więcej informacji można znaleźć w instrukcjach autora poniżej lub kontaktując się bezpośrednio z FlipThatLot.
TradingView NIE zaleca płacenia za skrypt ani korzystania z niego, jeśli nie ma pełnego zaufania do jego autora i nie rozumie się zasad jego działania. Można również znaleźć darmowe, otwartoźródłowe alternatywy w skryptach społeczności.