OPEN-SOURCE SCRIPT
Zaktualizowano SMA 119
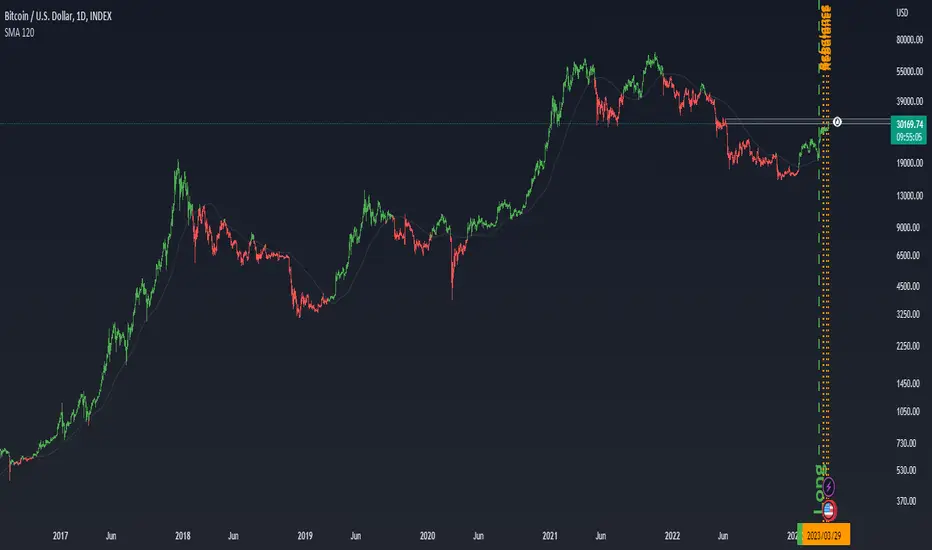
Sometimes simplicity is a key.
This is a Simple Moving Average of 119 period on daily timeframe.
When hl2 of price is above SMA it plot green candles (up trend), when below it plot red candles (down trend)
So it shows you a long term direction of BTC
It is very useful indicator to see in what stage BTC is now, Bear or Bull. Yes it seems to be very simple, but it works.
Sometimes to dig a hole, you dont need an excavator you just need an shovel. In this case shovel is a SMA =)
BackTest of indicator
https://www.tradingview.com/x/boR3okbF
Informacje o Wersji
-Skrypt open-source
W duchu TradingView twórca tego skryptu udostępnił go jako open-source, aby traderzy mogli analizować i weryfikować jego funkcjonalność. Brawo dla autora! Możesz korzystać z niego za darmo, ale pamiętaj, że ponowna publikacja kodu podlega naszym Zasadom Społeczności.
Wyłączenie odpowiedzialności
Informacje i publikacje przygotowane przez TradingView lub jego użytkowników, prezentowane na tej stronie, nie stanowią rekomendacji ani porad handlowych, inwestycyjnych i finansowych i nie powinny być w ten sposób traktowane ani wykorzystywane. Więcej informacji na ten temat znajdziesz w naszym Regulaminie.
Skrypt open-source
W duchu TradingView twórca tego skryptu udostępnił go jako open-source, aby traderzy mogli analizować i weryfikować jego funkcjonalność. Brawo dla autora! Możesz korzystać z niego za darmo, ale pamiętaj, że ponowna publikacja kodu podlega naszym Zasadom Społeczności.
Wyłączenie odpowiedzialności
Informacje i publikacje przygotowane przez TradingView lub jego użytkowników, prezentowane na tej stronie, nie stanowią rekomendacji ani porad handlowych, inwestycyjnych i finansowych i nie powinny być w ten sposób traktowane ani wykorzystywane. Więcej informacji na ten temat znajdziesz w naszym Regulaminie.