PROTECTED SOURCE SCRIPT
Muzyorae - RTH Anchored Quarters Cycles
RTH Anchored Quarters Cycles — Model Overview
The RTH Anchored Quarters Cycles model is designed to divide the Regular Trading Hours (RTH) session of U.S. equities (typically 09:30 – 16:00 New York time) into four structured “quarters” plus a closing marker. It provides a consistent framework for analyzing intraday market behavior by aligning time-based partitions with the actual trading day.
Key Features
Anchored to RTH
The model starts each cycle at 09:30 NY time (the official cash open).
It ignores overnight or extended-hours data, focusing strictly on the RTH session, where the majority of institutional order flow takes place.
After 18:00 NY time, the model still references the same trading date, preventing false signals from session rollovers.
Quarterly Time Blocks
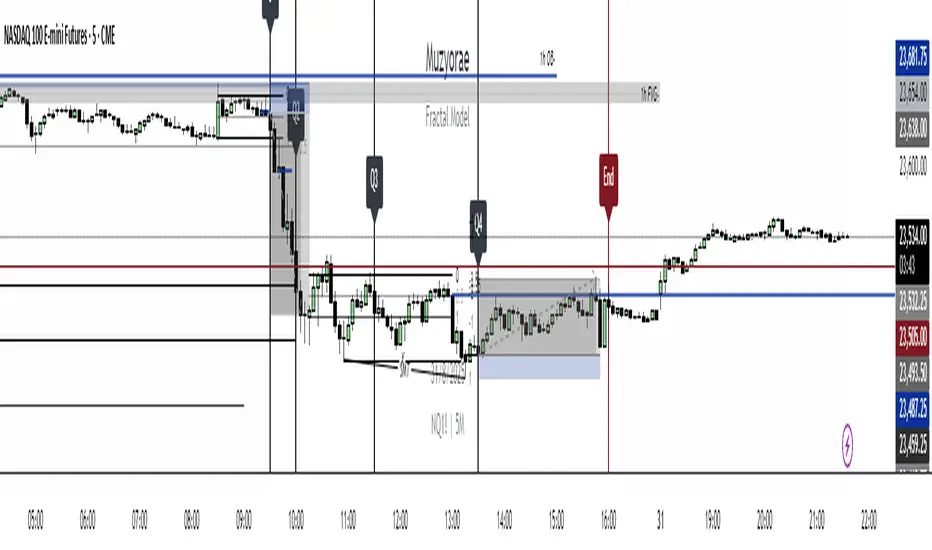
The trading day is split into five reference points:
Q1: 09:30 – 10:00
Q2: 10:00 – 11:30
Q3: 11:30 – 13:30
Q4: 13:30 – 16:00
End: Closing marker at 16:00
Each boundary is drawn as a vertical line on the chart, clearly separating the quarters.
Customization
Users can adjust the start/end times of each quarter.
So if you would like to wish to use ICT timing Macro, intraday, daily and even weekly
The line style, color, and width are configurable (solid/dotted/dashed).
A label is placed at each quarter boundary (Q1, Q2, Q3, Q4, End) for quick visual reference.
Days Back Control
The model can display the cycles for multiple past trading days (user-defined).
Weekend days are automatically skipped, so “2 days back” means today and the previous trading day.
Why It’s Useful
Intraday Structure: Traders can quickly identify where the market is within the daily RTH cycle.
Consistency: Since the model is anchored to RTH, it avoids confusion caused by overnight Globex activity.
Clarity: Vertical markers and labels provide a clean framework for aligning trade setups, volume analysis, or order flow studies with specific time windows.
Flexibility: The customizable settings allow adaptation across instruments and strategies.
The RTH Anchored Quarters Cycles model is designed to divide the Regular Trading Hours (RTH) session of U.S. equities (typically 09:30 – 16:00 New York time) into four structured “quarters” plus a closing marker. It provides a consistent framework for analyzing intraday market behavior by aligning time-based partitions with the actual trading day.
Key Features
Anchored to RTH
The model starts each cycle at 09:30 NY time (the official cash open).
It ignores overnight or extended-hours data, focusing strictly on the RTH session, where the majority of institutional order flow takes place.
After 18:00 NY time, the model still references the same trading date, preventing false signals from session rollovers.
Quarterly Time Blocks
The trading day is split into five reference points:
Q1: 09:30 – 10:00
Q2: 10:00 – 11:30
Q3: 11:30 – 13:30
Q4: 13:30 – 16:00
End: Closing marker at 16:00
Each boundary is drawn as a vertical line on the chart, clearly separating the quarters.
Customization
Users can adjust the start/end times of each quarter.
So if you would like to wish to use ICT timing Macro, intraday, daily and even weekly
The line style, color, and width are configurable (solid/dotted/dashed).
A label is placed at each quarter boundary (Q1, Q2, Q3, Q4, End) for quick visual reference.
Days Back Control
The model can display the cycles for multiple past trading days (user-defined).
Weekend days are automatically skipped, so “2 days back” means today and the previous trading day.
Why It’s Useful
Intraday Structure: Traders can quickly identify where the market is within the daily RTH cycle.
Consistency: Since the model is anchored to RTH, it avoids confusion caused by overnight Globex activity.
Clarity: Vertical markers and labels provide a clean framework for aligning trade setups, volume analysis, or order flow studies with specific time windows.
Flexibility: The customizable settings allow adaptation across instruments and strategies.
Skrypt chroniony
Ten skrypt został opublikowany jako zamknięty kod źródłowy. Można z tego korzystać swobodnie i bez żadnych ograniczeń — więcej informacji znajduje się tutaj.
Wyłączenie odpowiedzialności
Informacje i publikacje nie stanowią i nie powinny być traktowane jako porady finansowe, inwestycyjne, tradingowe ani jakiekolwiek inne rekomendacje dostarczane lub zatwierdzone przez TradingView. Więcej informacji znajduje się w Warunkach użytkowania.