PROTECTED SOURCE SCRIPT
Wüsten
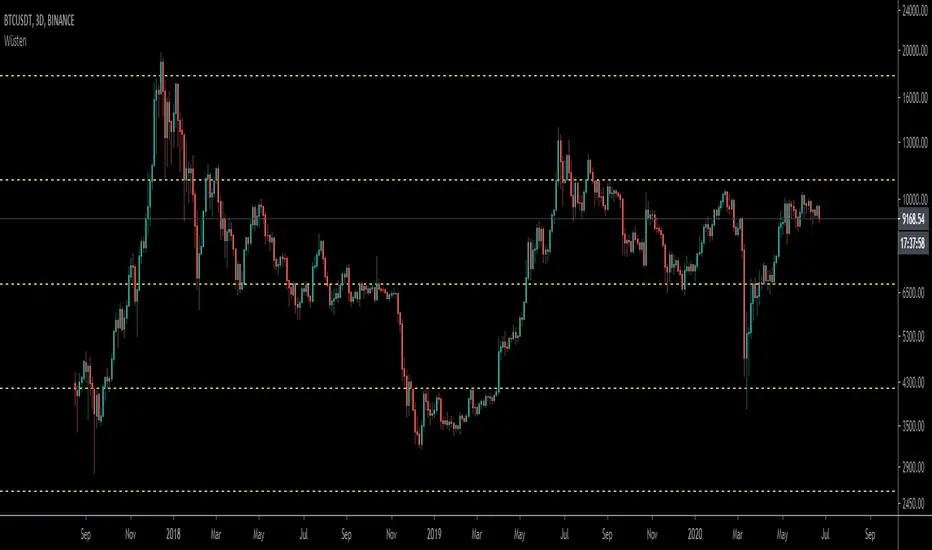
Plots Fibonacci Levels Automatically
Instruction to add it:
1) Click Below Right button: ADD TO FAVORITE SCRIPTS.
2) On your chart, click Indicators, search for Wusten
3) Once added on left go to settings.... Leave INPUT tab, click STYLE tab.
4) UN-TICK ALL PLOT boxes.
5) Scroll all the way down and at the very bottom left click DEFAULTS, and click SAVE AS DEFAULT.
(if you DON'T un-tick all PLOT boxes it draws another line on top of the dashed line for some reason).
6) The color should be as close to the one you wanted.
If not take time and correct the colors on the STYLE tab BUT remember to always go and click SAVE AS DEFAULT when done.
Then your colors will always stay like that.
Skrypt chroniony
Ten skrypt został opublikowany jako zamknięty kod źródłowy. Można z tego korzystać swobodnie i bez żadnych ograniczeń — więcej informacji znajduje się tutaj.
Wyłączenie odpowiedzialności
Informacje i publikacje nie stanowią i nie powinny być traktowane jako porady finansowe, inwestycyjne, tradingowe ani jakiekolwiek inne rekomendacje dostarczane lub zatwierdzone przez TradingView. Więcej informacji znajduje się w Warunkach użytkowania.