OPEN-SOURCE SCRIPT
PHD-Points

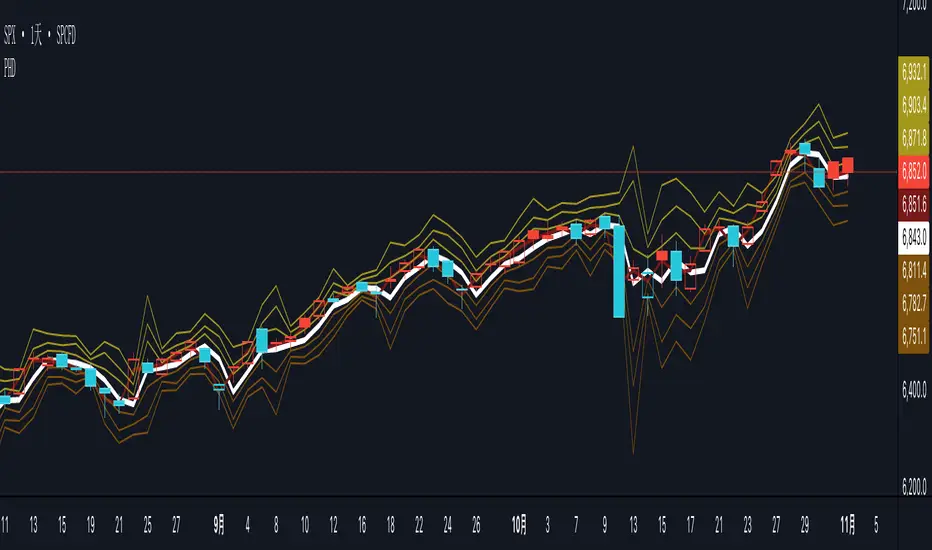
The PHD Pivot Points indicator is a professional-grade support and resistance tool that calculates key price levels based on previous day's price action and current intraday data. It provides traders with multiple reference points for identifying potential reversal zones, breakout levels, and strategic entry/exit positions.
Key Components
1. Previous Day Pivot Point (P)
White Line - The main pivot level calculated from previous day's High, Low, and Close
Formula: P = (Previous High + Previous Low + Previous Close) / 3
Serves as the central reference point for the trading day
Often acts as a psychological support/resistance level
2. Previous Day Support Levels (D1, D2, D3)
Brown Lines - Three support levels below the previous day's pivot
D1 (Support 1): First support level, closest to pivot
D2 (Support 2): Second support level, medium-strength
D3 (Support 3): Third support level, strongest support
Calculated using previous day's high and low ranges
3. Previous Day Resistance Levels (H1, H2, H3)
Yellow-Brown Lines - Three resistance levels above the previous day's pivot
H1 (Resistance 1): First resistance level, closest to pivot
H2 (Resistance 2): Second resistance level, medium-strength
H3 (Resistance 3): Third resistance level, strongest resistance
Calculated using previous day's high and low ranges
4. Today's Pivot Point (PT)
Dark Red Line - Dynamic pivot point that updates throughout the current trading session
Formula: PT = (Current High + Current Low + Current Close) / 3
Provides real-time trend reference for intraday trading
Helps identify intraday momentum and trend strength
5. Today's Dynamic Levels (DD1-DD3, HH1-HH3)
Calculated but not plotted by default
These values represent current session's support and resistance levels
Can be used for advanced intraday analysis
Trading Applications
Support and Resistance Trading
Price tends to bounce at D1, D2, D3 levels (potential buy zones)
Price tends to stall or reverse at H1, H2, H3 levels (potential sell zones)
Breaks above/below these levels signal trend strength
Trend Identification
Price above P = Bullish bias
Price below P = Bearish bias
PT line angle shows intraday momentum direction
Skrypt open-source
W zgodzie z duchem TradingView twórca tego skryptu udostępnił go jako open-source, aby użytkownicy mogli przejrzeć i zweryfikować jego działanie. Ukłony dla autora. Korzystanie jest bezpłatne, jednak ponowna publikacja kodu podlega naszym Zasadom serwisu.
Wyłączenie odpowiedzialności
Informacje i publikacje nie stanowią i nie powinny być traktowane jako porady finansowe, inwestycyjne, tradingowe ani jakiekolwiek inne rekomendacje dostarczane lub zatwierdzone przez TradingView. Więcej informacji znajduje się w Warunkach użytkowania.