OPEN-SOURCE SCRIPT
Risk On/Risk Off Williams %R
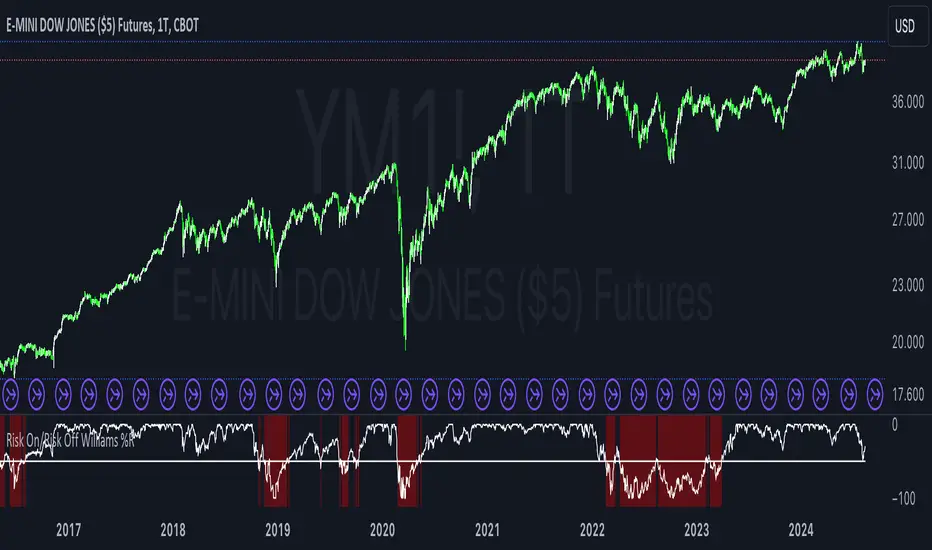
The Risk On/Risk Off Williams %R indicator is a technical analysis tool designed to gauge market sentiment by comparing the performance of risk-on and risk-off assets. This indicator combines the Williams %R, a momentum oscillator, with a composite index derived from various financial assets to determine the prevailing market risk sentiment.
Components:
Risk-On Assets: These are typically more volatile and are expected to perform well during bullish market conditions. The indicator uses the following risk-on assets:
SPY (S&P 500 ETF)
QQQ (Nasdaq-100 ETF)
HYG (High-Yield Corporate Bond ETF)
XLF (Financial Select Sector SPDR Fund)
XLK (Technology Select Sector SPDR Fund)
Risk-Off Assets: These are generally considered safer investments and are expected to outperform during bearish market conditions. The indicator includes:
TLT (iShares 20+ Year Treasury Bond ETF)
GLD (SPDR Gold Trust)
DXY (U.S. Dollar Index)
IEF (iShares 7-10 Year Treasury Bond ETF)
XLU (Utilities Select Sector SPDR Fund)
Calculation:
Risk-On Index: The average closing price of the risk-on assets.
Risk-Off Index: The average closing price of the risk-off assets.
The composite index is computed as:
Composite Index=Risk On Index−Risk Off Index
Composite Index=Risk On Index−Risk Off Index
Williams %R: This momentum oscillator measures the current price relative to the high-low range over a specified period. It is calculated as:
\text{Williams %R} = \frac{\text{Highest High} - \text{Composite Index}}{\text{Highest High} - \text{Lowest Low}} \times -100
where "Highest High" and "Lowest Low" are the highest and lowest values of the composite index over the lookback period.
Usage:
Williams %R: A momentum oscillator that ranges from -100 to 0. Values above -50 suggest bullish conditions, while values below -50 indicate bearish conditions.
Background Color: The background color of the chart changes based on the Williams %R relative to a predefined threshold level:
Green background: When Williams %R is above the threshold level, indicating a bullish sentiment.
Red background: When Williams %R is below the threshold level, indicating a bearish sentiment.
Purpose:
The indicator is designed to provide a visual representation of market sentiment by comparing the performance of risk-on versus risk-off assets. It helps traders and investors understand whether the market is leaning towards higher risk (risk-on) or safety (risk-off) based on the relative performance of these asset classes. By incorporating the Williams %R, the indicator adds a momentum-based dimension to this analysis, allowing for better decision-making in response to shifting market conditions.
Skrypt open-source
W zgodzie z duchem TradingView twórca tego skryptu udostępnił go jako open-source, aby użytkownicy mogli przejrzeć i zweryfikować jego działanie. Ukłony dla autora. Korzystanie jest bezpłatne, jednak ponowna publikacja kodu podlega naszym Zasadom serwisu.
Where others speculate, we systematize.
edgetools.org
edgetools.org
Wyłączenie odpowiedzialności
Informacje i publikacje nie stanowią i nie powinny być traktowane jako porady finansowe, inwestycyjne, tradingowe ani jakiekolwiek inne rekomendacje dostarczane lub zatwierdzone przez TradingView. Więcej informacji znajduje się w Warunkach użytkowania.