OPEN-SOURCE SCRIPT
Zaktualizowano HTF Candle Boxes for LTF Charts
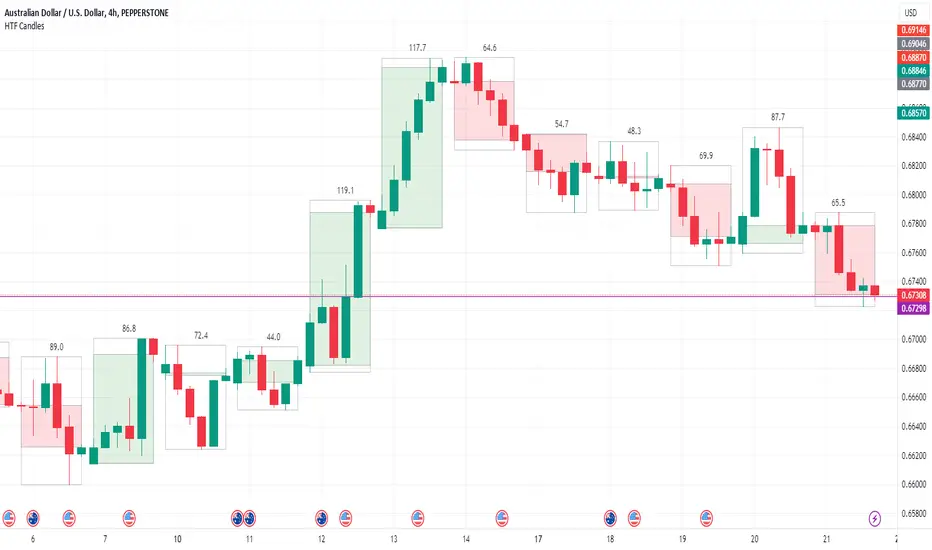
This indicator allows you to show an outline of a Higher Time Frame (HTF) candle on a Lower Time Frame (LTF) chart. Options include selecting the HTF interval, and an option to either show a single shaded Box for the candle (High to Low), or a shaded box for the body (Open to Close) with the High to Low shown in an unshaded box. The purpose is to easily visualise what the previous HTF candles look like as you are working on the lower charts, for example was yesterday's candle Bullish, Bearsish, indecision, a Doji etc.
Informacje o Wersji
Added the option to not paint the current HTF bar, default is not Informacje o Wersji
This version cleans up the painting of the last candle as previously it would create multiple boxes on each new candle if in real-time. Also added is the optional inclusion to show the Pip-Range of the HTF candle.
Informacje o Wersji
v4 10-Dec-23 - minor fix - occasionally the HTF box was paniting the wrong colour (for Doji-type Candles) because it was looking at the current candle rather than the last candle for that box. Informacje o Wersji
Version 5 - 26-Dec-24 Coverted to Pine V6, Fixed issues with the last candle update, added option for Mid-Line, reorganised the menu.
KNOWN ISSUE -- This does not work with non-divisble timeframes. The LTF candle open and close dictates the HTF data. For example a 2min chart with a 5min HTF. Because the M5 changes halfway through a M2 candle, you will end up with a series of 2 bar then 3 bar HTF candles. Simarly a weekly chart with a Monthly HTF because a month may end mid-week (not divisible)
Skrypt open-source
W duchu TradingView twórca tego skryptu udostępnił go jako open-source, aby traderzy mogli analizować i weryfikować jego funkcjonalność. Brawo dla autora! Możesz korzystać z niego za darmo, ale pamiętaj, że ponowna publikacja kodu podlega naszym Zasadom Społeczności.
Wyłączenie odpowiedzialności
Informacje i publikacje przygotowane przez TradingView lub jego użytkowników, prezentowane na tej stronie, nie stanowią rekomendacji ani porad handlowych, inwestycyjnych i finansowych i nie powinny być w ten sposób traktowane ani wykorzystywane. Więcej informacji na ten temat znajdziesz w naszym Regulaminie.