PROTECTED SOURCE SCRIPT
CryptoSmart Octa-MA Trend
CryptoSmart Octa-MA Trend: Detailed Indicator Description
1. Core Concept
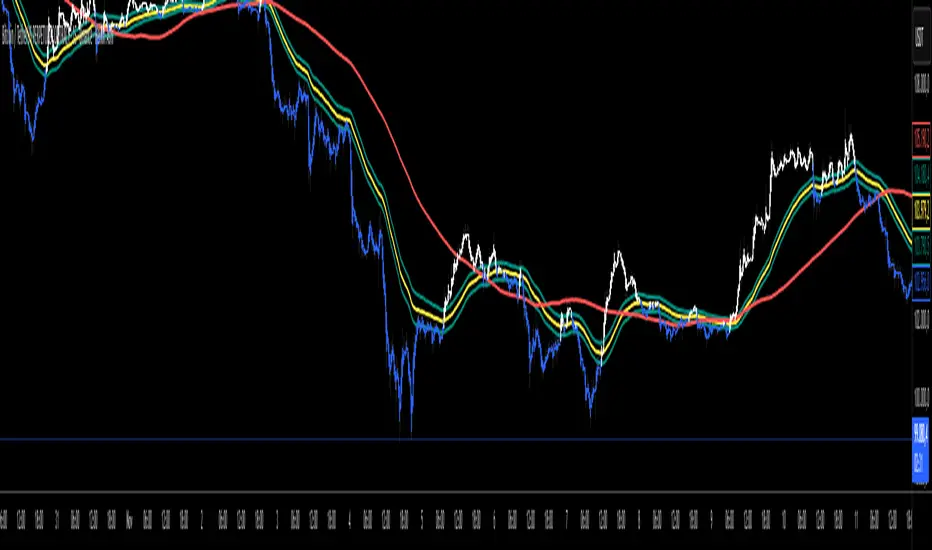
The "CryptoSmart Octa-MA Trend" is a comprehensive, multi-layered trend visualization tool. Its primary function is to display an 8-line moving average (MA) ribbon while simultaneously coloring the main chart's candles to reflect the price's position relative to one single, user-selected "base" MA.
This dual-function system allows you to:
Instantly identify the primary trend regime (bullish or bearish) via the candle colors.
Analyze the market structure (support, resistance, momentum) using the 8-line MA ribbon.
2. Key Features
8-Line MA Ribbon: A fully customizable ribbon of 8 independent moving averages.
Dynamic Candle Coloring: The main chart's candles are colored (by default, White for bullish, Blue for bearish) based on the price's position relative to your chosen "base" MA.
Total Customization: Every single MA line can be independently configured:
Type: EMA, SMA, WMA, VWMA, or RMA.
Source: Close, High, Low, Open, etc.
Length: Any period.
Color: Any color.
Visibility Control: Each of the 8 MAs can be toggled on or off from the "Visibility" tab, allowing you to create a clean chart that shows only the MAs you need while keeping the logic of the hidden MAs active (e.g., for the bar color).
3. How It Works: The Logic Explained
The indicator's logic is split into two main components:
1. The Ribbon Calculation The script calculates 8 independent moving averages (ma1 through ma8). The custom f_ma() function allows each one to be an EMA, SMA, WMA, etc., based on your selections in the "Configuración de la Cinta" (Ribbon Configuration) tab. This gives you complete control over building complex ribbon structures.
2. The Bar Coloring Logic This is the indicator's core visual feature:
You select a "base" MA using the "MA Base para el Color" dropdown (defaulting to MA #2).
The script then runs a simple but powerful check on every bar:
if close > ma_for_color (Is the closing price above the base MA?)
If true, the color_bull (default White) is applied to the candle.
If false, the color_bear (default Blue) is applied.
This barcolor function provides an immediate, unambiguous visual representation of the trend as defined by your single most important moving average.
4. How to Use It (Strategy & Interpretation)
This indicator is designed for trend confluence trading.
Primary Trend Filter: Use the candle colors as your main trend filter.
If candles are White (Bullish, close > MA #2), you should primarily be looking for buy/long opportunities.
If candles are Blue (Bearish, close < MA #2), you should primarily be looking for sell/short opportunities.
Dynamic Support & Resistance: Use the visible ribbon lines (MAs #1-4 by default) as dynamic levels of support or resistance.
Example (Bullish): If the candles are White, a price pullback that touches the MA #3 (80 EMA of Low) or the MA #4 (200 SMA) could be a "buy the dip" opportunity.
Example (Bearish): If the candles are Blue, a price rally that touches the MA #1 (80 EMA of High) could be a "sell the rally" opportunity.
Context & Momentum: The hidden MAs (MAs #5-8, which are shorter-term EMAs like 21, 34, 55, 89) can be toggled on to analyze the short-term momentum within the larger trend structure.
5. Default Settings (Based on Your Images)
The indicator loads with a specific preset designed for immediate use:
Visible MAs (Default):
MA #1: 80-period EMA (Source: High)
MA #2: 80-period EMA (Source: Close)
MA #3: 80-period EMA (Source: Low)
MA #4: 200-period SMA (Source: Close)
Hidden MAs (Default): MAs #5-8 (21, 34, 55, 89 EMAs) are hidden but can be enabled.
Bar Color: The default coloring is ON, using MA #2 as the base.
1. Core Concept
The "CryptoSmart Octa-MA Trend" is a comprehensive, multi-layered trend visualization tool. Its primary function is to display an 8-line moving average (MA) ribbon while simultaneously coloring the main chart's candles to reflect the price's position relative to one single, user-selected "base" MA.
This dual-function system allows you to:
Instantly identify the primary trend regime (bullish or bearish) via the candle colors.
Analyze the market structure (support, resistance, momentum) using the 8-line MA ribbon.
2. Key Features
8-Line MA Ribbon: A fully customizable ribbon of 8 independent moving averages.
Dynamic Candle Coloring: The main chart's candles are colored (by default, White for bullish, Blue for bearish) based on the price's position relative to your chosen "base" MA.
Total Customization: Every single MA line can be independently configured:
Type: EMA, SMA, WMA, VWMA, or RMA.
Source: Close, High, Low, Open, etc.
Length: Any period.
Color: Any color.
Visibility Control: Each of the 8 MAs can be toggled on or off from the "Visibility" tab, allowing you to create a clean chart that shows only the MAs you need while keeping the logic of the hidden MAs active (e.g., for the bar color).
3. How It Works: The Logic Explained
The indicator's logic is split into two main components:
1. The Ribbon Calculation The script calculates 8 independent moving averages (ma1 through ma8). The custom f_ma() function allows each one to be an EMA, SMA, WMA, etc., based on your selections in the "Configuración de la Cinta" (Ribbon Configuration) tab. This gives you complete control over building complex ribbon structures.
2. The Bar Coloring Logic This is the indicator's core visual feature:
You select a "base" MA using the "MA Base para el Color" dropdown (defaulting to MA #2).
The script then runs a simple but powerful check on every bar:
if close > ma_for_color (Is the closing price above the base MA?)
If true, the color_bull (default White) is applied to the candle.
If false, the color_bear (default Blue) is applied.
This barcolor function provides an immediate, unambiguous visual representation of the trend as defined by your single most important moving average.
4. How to Use It (Strategy & Interpretation)
This indicator is designed for trend confluence trading.
Primary Trend Filter: Use the candle colors as your main trend filter.
If candles are White (Bullish, close > MA #2), you should primarily be looking for buy/long opportunities.
If candles are Blue (Bearish, close < MA #2), you should primarily be looking for sell/short opportunities.
Dynamic Support & Resistance: Use the visible ribbon lines (MAs #1-4 by default) as dynamic levels of support or resistance.
Example (Bullish): If the candles are White, a price pullback that touches the MA #3 (80 EMA of Low) or the MA #4 (200 SMA) could be a "buy the dip" opportunity.
Example (Bearish): If the candles are Blue, a price rally that touches the MA #1 (80 EMA of High) could be a "sell the rally" opportunity.
Context & Momentum: The hidden MAs (MAs #5-8, which are shorter-term EMAs like 21, 34, 55, 89) can be toggled on to analyze the short-term momentum within the larger trend structure.
5. Default Settings (Based on Your Images)
The indicator loads with a specific preset designed for immediate use:
Visible MAs (Default):
MA #1: 80-period EMA (Source: High)
MA #2: 80-period EMA (Source: Close)
MA #3: 80-period EMA (Source: Low)
MA #4: 200-period SMA (Source: Close)
Hidden MAs (Default): MAs #5-8 (21, 34, 55, 89 EMAs) are hidden but can be enabled.
Bar Color: The default coloring is ON, using MA #2 as the base.
Skrypt chroniony
Ten skrypt został opublikowany jako zamknięty kod źródłowy. Można z tego korzystać swobodnie i bez żadnych ograniczeń — więcej informacji znajduje się tutaj.
Wyłączenie odpowiedzialności
Informacje i publikacje nie stanowią i nie powinny być traktowane jako porady finansowe, inwestycyjne, tradingowe ani jakiekolwiek inne rekomendacje dostarczane lub zatwierdzone przez TradingView. Więcej informacji znajduje się w Warunkach użytkowania.