OPEN-SOURCE SCRIPT
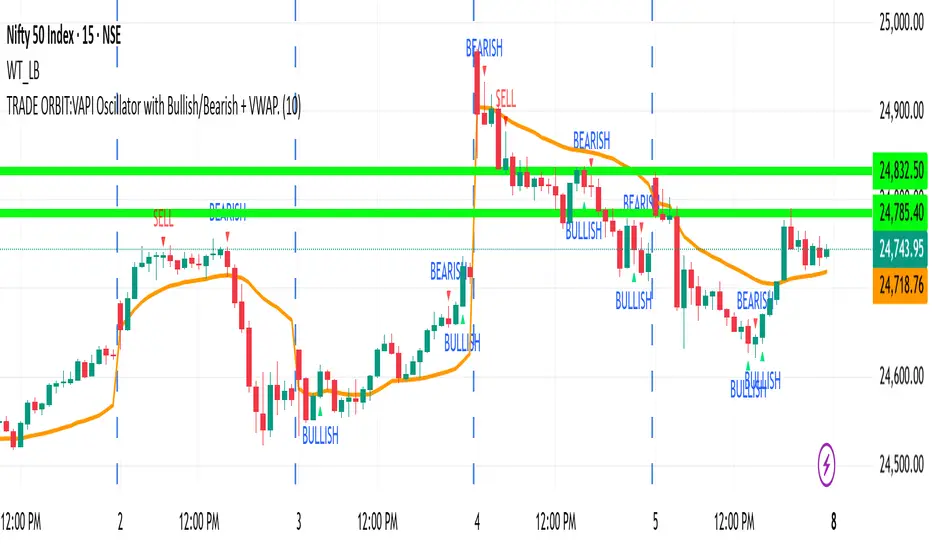
TRADE ORBIT:VAPI Oscillator with Bullish/Bearish + VWAP.
Components
VAPI Oscillator
Shows the balance of buying vs. selling pressure using price and volume.
Plotted as a histogram (green above zero, red below zero) with a gray oscillator line.
Zero line (gray) acts as the main threshold between bullish and bearish pressure.
Signals
Bullish Signal (▲ BULLISH) → Triggered when VAPI crosses above zero.
Bearish Signal (▼ BEARISH) → Triggered when VAPI crosses below zero.
Alerts are included for automation/notifications.
VWAP (Volume Weighted Average Price)
Plotted on the main price chart (orange line).
Resets each new trading day.
Acts as an institutional benchmark for trend and fair value.
🔹 How to Use
When VAPI crosses above zero → market pressure is bullish (look for long opportunities, especially if price is above VWAP).
When VAPI crosses below zero → market pressure is bearish (look for short opportunities, especially if price is below VWAP).
VWAP provides a strong support/resistance zone; confluence between VAPI and VWAP strengthens signals.
Skrypt open-source
W duchu TradingView twórca tego skryptu udostępnił go jako open-source, aby traderzy mogli analizować i weryfikować jego funkcjonalność. Brawo dla autora! Możesz korzystać z niego za darmo, ale pamiętaj, że ponowna publikacja kodu podlega naszym Zasadom Społeczności.
Wyłączenie odpowiedzialności
Informacje i publikacje przygotowane przez TradingView lub jego użytkowników, prezentowane na tej stronie, nie stanowią rekomendacji ani porad handlowych, inwestycyjnych i finansowych i nie powinny być w ten sposób traktowane ani wykorzystywane. Więcej informacji na ten temat znajdziesz w naszym Regulaminie.