OPEN-SOURCE SCRIPT
Zaktualizowano Pre-Market High & Low
Indicator: Pre-Market High & Low
This indicator tracks the high and low price levels of a stock during the pre-market session (4:00 AM - 9:30 AM EST), before the official market open. It dynamically updates during pre-market hours, identifying the highest and lowest prices reached. Once the pre-market session ends, these levels are saved and plotted on the chart as reference points for the regular market session.
Key Features:
Dynamic Updates: Continuously tracks the high and low during pre-market hours.
Visual Indicators: Plots horizontal lines representing the pre-market high (green) and low (red).
Post-Market Reference: Once pre-market ends, these levels remain visible for the regular market session as reference points for potential breakout or breakdown levels.
How to Use:
Use this indicator to identify potential breakout or breakdown levels that may happen at the market open.
The green line represents the highest price reached during pre-market, while the red line indicates the lowest price.
The indicator will stop updating once the pre-market session closes (9:30 AM EST) and will remain visible as reference levels throughout the trading day.
Ideal for:
Day traders looking for pre-market support and resistance levels.
Traders analyzing the initial market reaction based on pre-market price action.
Informacje o Wersji
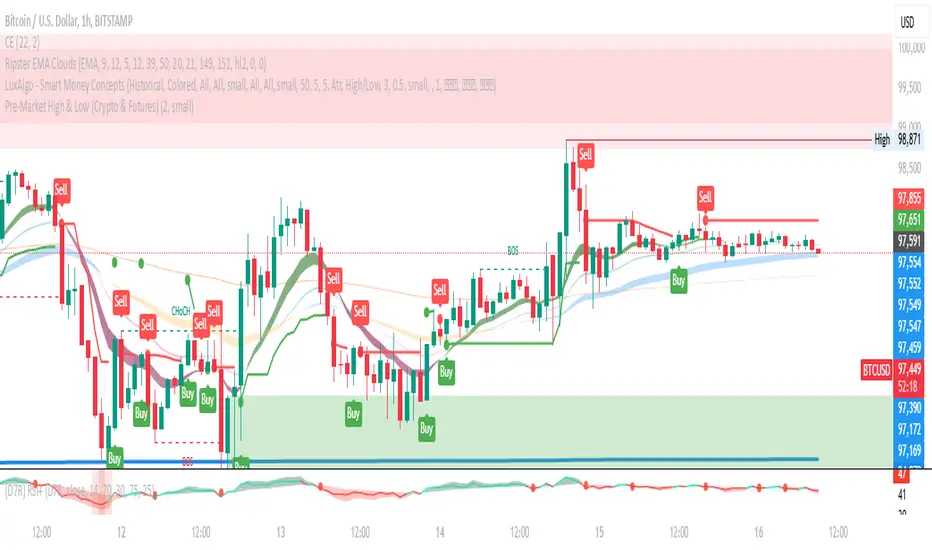
Title: Pre-Market High & Low Indicator (Crypto & Futures)Description:
This indicator tracks the pre-market high and low for assets including cryptocurrencies and futures (e.g., ES1!, NQ1!). It monitors price movements from 00:00 ET to 09:30 ET, marking the high and low levels for the session.
Pre-market range: Displayed after 09:30 ET.
Color-coded levels:
Green if the pre-market high is above the previous day's high.
Red if the pre-market low is below the previous day's low.
Blue otherwise.
Customizable settings: Adjust line thickness and label font size.
Dynamic updates: Levels refresh automatically based on the pre-market session.
Ideal for traders analyzing market trends before the official trading session begins. 🚀
Skrypt open-source
W zgodzie z duchem TradingView twórca tego skryptu udostępnił go jako open-source, aby użytkownicy mogli przejrzeć i zweryfikować jego działanie. Ukłony dla autora. Korzystanie jest bezpłatne, jednak ponowna publikacja kodu podlega naszym Zasadom serwisu.
Wyłączenie odpowiedzialności
Informacje i publikacje nie stanowią i nie powinny być traktowane jako porady finansowe, inwestycyjne, tradingowe ani jakiekolwiek inne rekomendacje dostarczane lub zatwierdzone przez TradingView. Więcej informacji znajduje się w Warunkach użytkowania.