OPEN-SOURCE SCRIPT
OHLC OLHC - Monthly, Weekly, Daily and Hourly
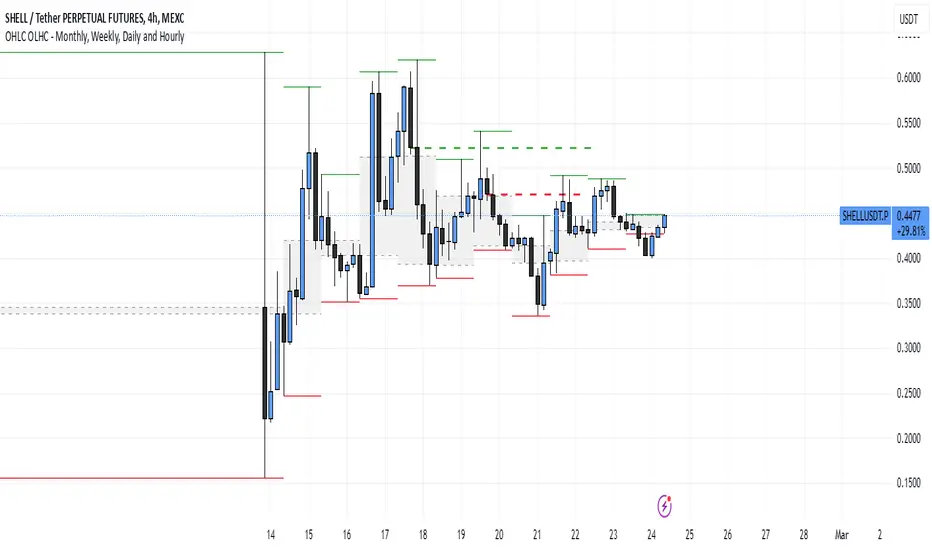
This indicator plots the previous day's (or any selected timeframe’s) Open, High, Low, and Close (OHLC) levels on the current chart. It helps traders analyze historical price levels to identify support and resistance zones.
Key Features:
Multi-Timeframe Support:
Users can select a timeframe (D, W, M, etc.) to fetch previous OHLC data.
The script requests OHLC values from the selected timeframe and overlays them on the current chart.
Customizable Display Options:
Users can choose to display only the last OHLC levels instead of all past session levels.
Users can extend the OHLC lines across the chart.
Background Highlighting:
The script fills the background only for the Previous Open and Previous Close levels, making them visually distinct.
Previous High and Low levels do not have background color.
This script is particularly useful for day traders and swing traders who rely on key price levels to make trading decisions. Let me know if you need further refinements!
Skrypt open-source
W zgodzie z duchem TradingView twórca tego skryptu udostępnił go jako open-source, aby użytkownicy mogli przejrzeć i zweryfikować jego działanie. Ukłony dla autora. Korzystanie jest bezpłatne, jednak ponowna publikacja kodu podlega naszym Zasadom serwisu.
Wyłączenie odpowiedzialności
Informacje i publikacje nie stanowią i nie powinny być traktowane jako porady finansowe, inwestycyjne, tradingowe ani jakiekolwiek inne rekomendacje dostarczane lub zatwierdzone przez TradingView. Więcej informacji znajduje się w Warunkach użytkowania.