OPEN-SOURCE SCRIPT
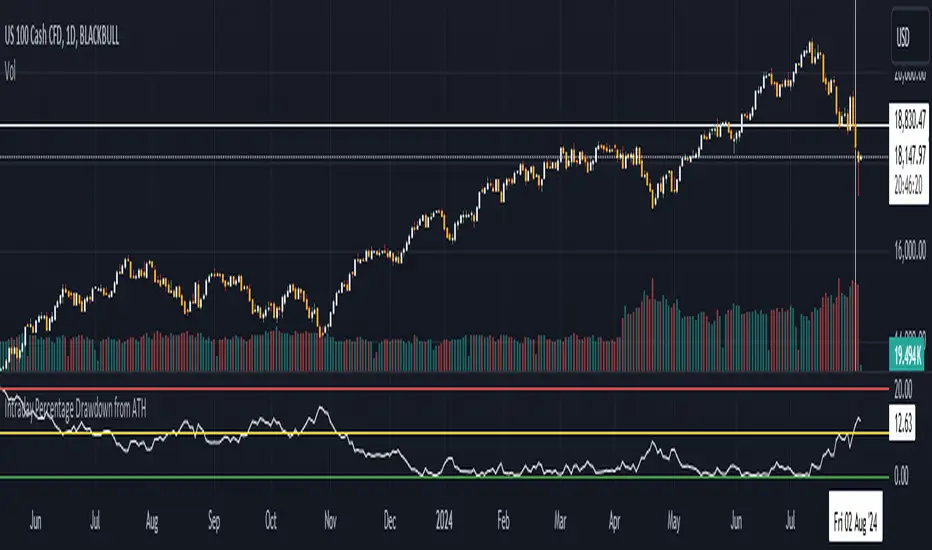
Intraday Percentage Drawdown from ATH
Track Intraday ATH:
The script maintains an intradayATH variable to track the highest price reached during the trading day up to the current point.
This variable is updated whenever a new high is reached.
Calculate Drawdown and Percentage Drawdown:
The drawdown is calculated as the difference between the intradayATH and the current closing price (close).
The percentage drawdown is calculated by dividing the drawdown by the intradayATH and multiplying by 100.
Plot Percentage Drawdown:
The percentageDrawdown is plotted on the chart with a red line to visually represent the drawdown from the intraday all-time high.
Draw Recession Line:
A horizontal red line is drawn at the 20.00 level, labeled "Recession". The line is styled as dotted and has a width of 2 for better visibility.
Draw Correction Line:
A horizontal yellow line is drawn at the 10.00 level, labeled "Correction". The line is styled as dotted and has a width of 2 for better visibility.
Draw All Time High Line:
A horizontal green line is drawn at the 0.0 level to represent the all-time high, labeled "All Time High". The line is styled as dotted and has a width of 2 for better visibility.
This script will display the percentage drawdown along with reference lines at 20% (recession), 10% (correction), and 0% (all-time high).
Skrypt open-source
W zgodzie z duchem TradingView twórca tego skryptu udostępnił go jako open-source, aby użytkownicy mogli przejrzeć i zweryfikować jego działanie. Ukłony dla autora. Korzystanie jest bezpłatne, jednak ponowna publikacja kodu podlega naszym Zasadom serwisu.
Wyłączenie odpowiedzialności
Informacje i publikacje nie stanowią i nie powinny być traktowane jako porady finansowe, inwestycyjne, tradingowe ani jakiekolwiek inne rekomendacje dostarczane lub zatwierdzone przez TradingView. Więcej informacji znajduje się w Warunkach użytkowania.