OPEN-SOURCE SCRIPT
Zaktualizowano Flat Numbers
Customizable Price Range: Set the start price and end price to define the range in which horizontal lines will be plotted.
Line Color: Choose the color of the horizontal lines to match your chart's theme or personal preference.
Line Width: Adjust the width of the lines (from 1 to 5) to control their visibility.
Price Step Size: By default, the script plots lines every 100 price units within the range, but this step size can be customized if desired.
Dynamic Line Plotting: The script automatically calculates the number of lines needed and plots them at each interval between the start and end prices.
Informacje o Wersji
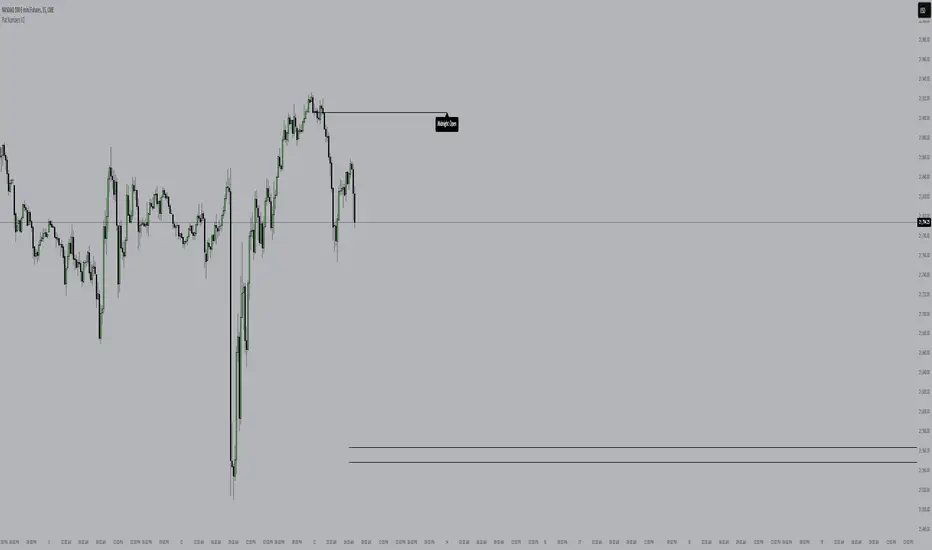
This script draws two lines on a chart:1. **Price Range Lines**: It lets you define a start and end price, then draws horizontal lines at every 100 price units in between.
2. **Opening Lines**: It draws two lines:
- One for the **Midnight Open** (00:00 NY time)
- One for the **08:30 Open** (NY time)
You can customize the color, style, and width of these lines, and optionally add labels showing "Midnight Open" or "08:30 Open". You can also choose the timezone.
In short: It helps visualize key price levels (range) and opening times with customizable lines and labels.
Informacje o Wersji
added 830am range Skrypt open-source
W zgodzie z duchem TradingView twórca tego skryptu udostępnił go jako open-source, aby użytkownicy mogli przejrzeć i zweryfikować jego działanie. Ukłony dla autora. Korzystanie jest bezpłatne, jednak ponowna publikacja kodu podlega naszym Zasadom serwisu.
Wyłączenie odpowiedzialności
Informacje i publikacje nie stanowią i nie powinny być traktowane jako porady finansowe, inwestycyjne, tradingowe ani jakiekolwiek inne rekomendacje dostarczane lub zatwierdzone przez TradingView. Więcej informacji znajduje się w Warunkach użytkowania.
Skrypt open-source
W zgodzie z duchem TradingView twórca tego skryptu udostępnił go jako open-source, aby użytkownicy mogli przejrzeć i zweryfikować jego działanie. Ukłony dla autora. Korzystanie jest bezpłatne, jednak ponowna publikacja kodu podlega naszym Zasadom serwisu.
Wyłączenie odpowiedzialności
Informacje i publikacje nie stanowią i nie powinny być traktowane jako porady finansowe, inwestycyjne, tradingowe ani jakiekolwiek inne rekomendacje dostarczane lub zatwierdzone przez TradingView. Więcej informacji znajduje się w Warunkach użytkowania.