OPEN-SOURCE SCRIPT
Zaktualizowano Hardwaybets' Protected Highs / Protected Lows Trading
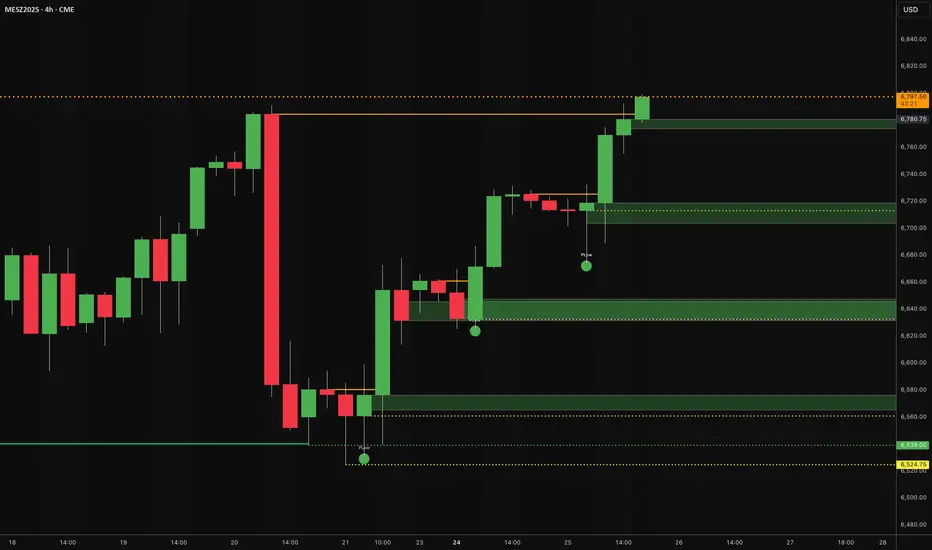
Protected Highs & Lows – Multi-Condition Structural Marker
This indicator identifies specific candle formations where price breaks a previous candle’s high or low, fails to maintain that break, and confirms the rejection with an additional condition involving prior candles. These marked locations offer a visual reference for areas where price attempted directional expansion but did not sustain it. All levels remain visible until later invalidated by price movement.
Protected High – Detection Logic
A Protected High is marked only when all three of the following conditions occur:
1. Break of Previous High
The current candle trades above the prior candle’s high.
2. Close Back Inside Range
The current candle closes within the high-to-low range of the previous candle, indicating the upward expansion was not sustained.
3. Reversal Through Prior Bullish Structure
After forming the high, price closes below the opening price of one or more bullish candles that were part of the upward movement into that high.
This reflects a shift away from the prior upward structure.
When all three conditions are met, the high of the candle that created the event is marked on the chart.
Protected Low – Detection Logic
A Protected Low is marked only when all three of the following conditions occur:
1. Break of Previous Low
The current candle trades below the prior candle’s low.
2. Close Back Inside Range
The current candle closes within the high-to-low range of the previous candle, indicating the downward expansion was not sustained.
3. Reversal Through Prior Bearish Structure
After forming the low, price closes above the opening price of one or more bearish candles that were part of the downward movement into that low.
This reflects a shift away from the prior downward structure.
When all three conditions are met, the low of the candle that created the event is marked on the chart.
Level Management
* Marked highs and lows remain active as long as price does not trade beyond them.
* If price moves past a marked level, that level is removed.
* Only active, unviolated structural reference points remain displayed.
Market Structure Context (Strictly Non-Signaling)
Protected highs and lows can help traders observe areas where:
* Price briefly exceeded a previous high or low
* That expansion was not maintained
* Price then moved back through recent candles associated with the prior direction
These observations can be used by traders to understand how price interacts with nearby structural reference points.
The indicator itself does not provide trade entries, exits, or directional guidance.
Customization Options
The indicator provides adjustable settings for:
* Marker style (labels or shapes)
* Shape type (circle, square, diamond, etc.)
* Colors for highs and lows
* Vertical spacing between markers and candles
These options help maintain clarity on different chart types and timeframes.
Intended Use
The indicator does not generate forecasts or trading signals.
Its purpose is to visually highlight multi-condition candle formations where price briefly exceeded a prior high or low, failed to sustain that expansion, and later reversed through nearby structural points.
Compatibility
Suitable for all assets and timeframes.
Informacje o Wersji
Update 11/27/2025---Just made it alertable.Skrypt open-source
W zgodzie z duchem TradingView twórca tego skryptu udostępnił go jako open-source, aby użytkownicy mogli przejrzeć i zweryfikować jego działanie. Ukłony dla autora. Korzystanie jest bezpłatne, jednak ponowna publikacja kodu podlega naszym Zasadom serwisu.
Wyłączenie odpowiedzialności
Informacje i publikacje nie stanowią i nie powinny być traktowane jako porady finansowe, inwestycyjne, tradingowe ani jakiekolwiek inne rekomendacje dostarczane lub zatwierdzone przez TradingView. Więcej informacji znajduje się w Warunkach użytkowania.
Skrypt open-source
W zgodzie z duchem TradingView twórca tego skryptu udostępnił go jako open-source, aby użytkownicy mogli przejrzeć i zweryfikować jego działanie. Ukłony dla autora. Korzystanie jest bezpłatne, jednak ponowna publikacja kodu podlega naszym Zasadom serwisu.
Wyłączenie odpowiedzialności
Informacje i publikacje nie stanowią i nie powinny być traktowane jako porady finansowe, inwestycyjne, tradingowe ani jakiekolwiek inne rekomendacje dostarczane lub zatwierdzone przez TradingView. Więcej informacji znajduje się w Warunkach użytkowania.