OPEN-SOURCE SCRIPT
Normalized and Smoothed Cumulative Delta for Top 5 NASDAQ Stocks
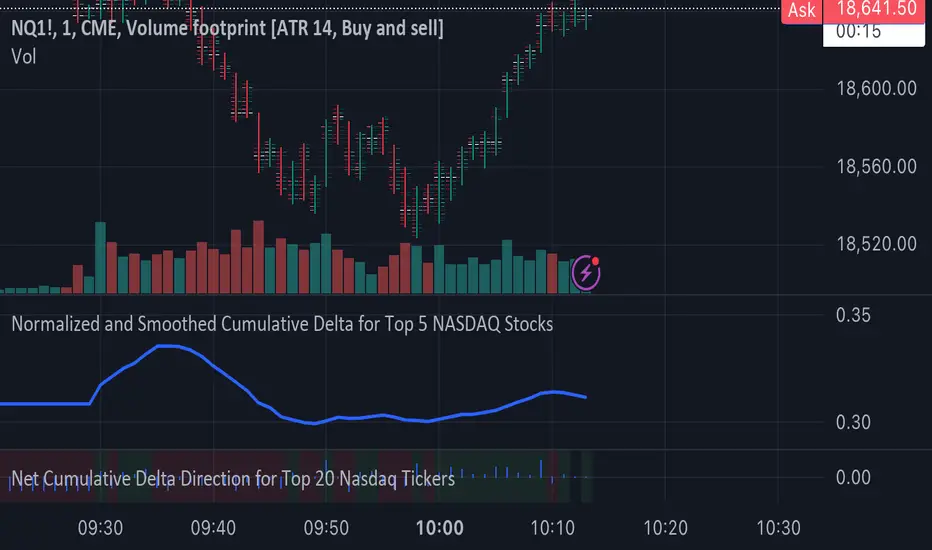
This script is designed to create a TradingView indicator called **"Normalized and Smoothed Cumulative Delta for Top 5 NASDAQ Stocks."** The purpose of this indicator is to track and visualize the cumulative price delta (the change in price from one period to the next) for the top five NASDAQ stocks: Apple Inc. (AAPL), Microsoft Corporation (MSFT), Alphabet Inc. (GOOGL), Amazon.com Inc. (AMZN), and Meta Platforms Inc. (FB).
### Key Features of the Script:
1. **Ticker Selection**:
- The script focuses on the top five NASDAQ stocks by automatically setting their tickers.
2. **Price Data Retrieval**:
- It fetches the closing prices for each of these stocks using the `request.security` function for the current timeframe.
3. **Delta Calculation**:
- The script calculates the delta for each stock, which is simply the difference between the current closing price and the previous closing price.
4. **Cumulative Delta Calculation**:
- It calculates the cumulative delta for each stock by adding the current delta to the previous cumulative delta. This helps track the total change in price over time.
5. **Summing and Smoothing**:
- The cumulative deltas for all five stocks are summed together.
- The script then applies an Exponential Moving Average (EMA) with a period of 5 to smooth the summed cumulative delta, making the indicator less sensitive to short-term fluctuations.
6. **Normalization**:
- To ensure the cumulative delta is easy to interpret, the script normalizes it to a range of 0 to 1. This is done by tracking the minimum and maximum values of the smoothed cumulative delta and scaling the data accordingly.
7. **Visualization**:
- The normalized cumulative delta is plotted as a smooth line, allowing users to see the overall trend of the cumulative price changes for the top five NASDAQ stocks.
- A horizontal line is added at 0.5, serving as a midline reference, which can help traders quickly assess whether the normalized cumulative delta is above or below its midpoint.
### Usage:
This indicator is particularly useful for traders and investors who want to monitor the aggregated price movements of the top NASDAQ stocks, providing a high-level view of market sentiment and trends. By smoothing and normalizing the data, it offers a clear and concise visualization that can be used to identify potential market turning points or confirm ongoing trends.
Skrypt open-source
W zgodzie z duchem TradingView twórca tego skryptu udostępnił go jako open-source, aby użytkownicy mogli przejrzeć i zweryfikować jego działanie. Ukłony dla autora. Korzystanie jest bezpłatne, jednak ponowna publikacja kodu podlega naszym Zasadom serwisu.
Wyłączenie odpowiedzialności
Informacje i publikacje nie stanowią i nie powinny być traktowane jako porady finansowe, inwestycyjne, tradingowe ani jakiekolwiek inne rekomendacje dostarczane lub zatwierdzone przez TradingView. Więcej informacji znajduje się w Warunkach użytkowania.