OPEN-SOURCE SCRIPT
RSI-Stochastic Hybrid
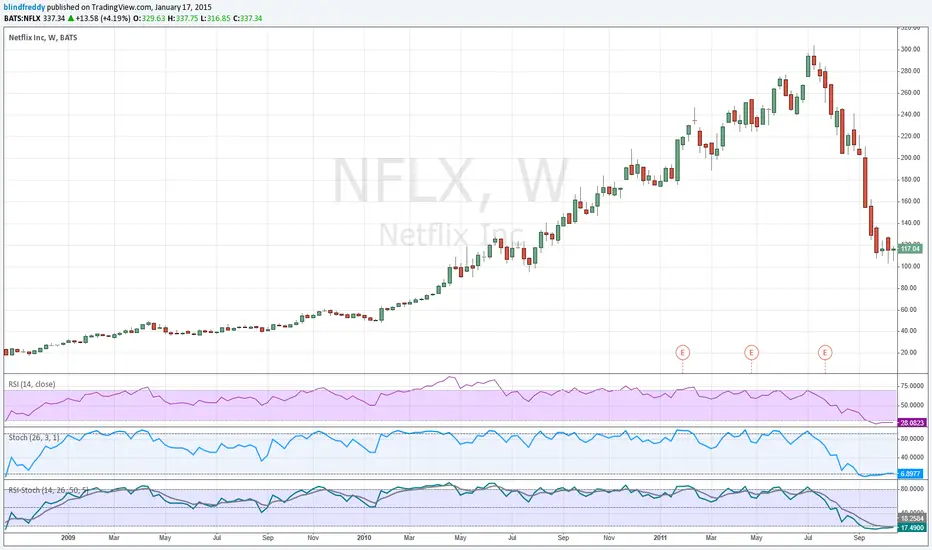
This is a very simple idea - an average of RSI and the Stochastic Oscillator. However it offers plenty of flexibility for tuning to your requirements. You can change the lengths of either indicator and the weighting of each. By default it's set to 50/50 (just change the percent RSI to adjust). There is also an optional EMA which can be used as a signal line.
This idea comes from Greg Morris who likes to use it for trend following. I would buy when the indicator hits the overbought line and sell when it goes below 50.
This idea comes from Greg Morris who likes to use it for trend following. I would buy when the indicator hits the overbought line and sell when it goes below 50.
Skrypt open-source
W zgodzie z duchem TradingView twórca tego skryptu udostępnił go jako open-source, aby użytkownicy mogli przejrzeć i zweryfikować jego działanie. Ukłony dla autora. Korzystanie jest bezpłatne, jednak ponowna publikacja kodu podlega naszym Zasadom serwisu.
Wyłączenie odpowiedzialności
Informacje i publikacje nie stanowią i nie powinny być traktowane jako porady finansowe, inwestycyjne, tradingowe ani jakiekolwiek inne rekomendacje dostarczane lub zatwierdzone przez TradingView. Więcej informacji znajduje się w Warunkach użytkowania.