RSI and RSI SMA Signal with Variable Levels
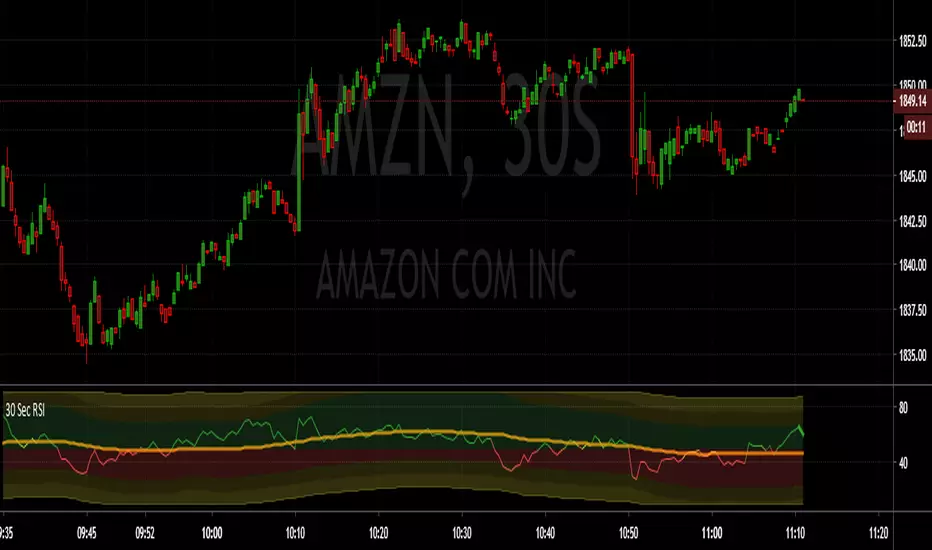
Plots RSI to the existing resolution.
Plots the 50 SMA (sourced from the RSI)
Colors the line red when below the 50 SMA and RSI is below 50.
Colors the line green when above the 50 SMA and RSI is above 50.
Banding:
Green from 50 to 70
Dark yellow from 70-80 and 30-20
Red from 50 to 30
Brighter yellow from 80-90 and 20-10
The banding varies if there is a trend in the 50 SMA that holds below the 50 level. This way it defines the levels safe to maintain a position during and not during a trend.
You will notice that the red area increases and the OS yellow area(s) decreases if a short trend has developed.
You will notice that the green area increases and the OB yellow area(s) decreases if a long trend has developed.
The maximum levels are limited to 90 and 10.
Skrypt tylko na zaproszenie
Dostęp do tego skryptu mają wyłącznie użytkownicy zatwierdzeni przez autora. Aby z niego korzystać, należy poprosić o zgodę i ją uzyskać. Zgoda jest zazwyczaj udzielana po dokonaniu płatności. Więcej informacji można znaleźć w instrukcjach autora poniżej lub kontaktując się bezpośrednio z kmack282.
TradingView NIE zaleca płacenia za skrypt ani korzystania z niego, jeśli nie ma pełnego zaufania do jego autora i nie rozumie się zasad jego działania. Można również znaleźć darmowe, otwartoźródłowe alternatywy w skryptach społeczności.
Instrukcje autora
Wyłączenie odpowiedzialności
Skrypt tylko na zaproszenie
Dostęp do tego skryptu mają wyłącznie użytkownicy zatwierdzeni przez autora. Aby z niego korzystać, należy poprosić o zgodę i ją uzyskać. Zgoda jest zazwyczaj udzielana po dokonaniu płatności. Więcej informacji można znaleźć w instrukcjach autora poniżej lub kontaktując się bezpośrednio z kmack282.
TradingView NIE zaleca płacenia za skrypt ani korzystania z niego, jeśli nie ma pełnego zaufania do jego autora i nie rozumie się zasad jego działania. Można również znaleźć darmowe, otwartoźródłowe alternatywy w skryptach społeczności.