PROTECTED SOURCE SCRIPT
Elastic Trend Oscillator
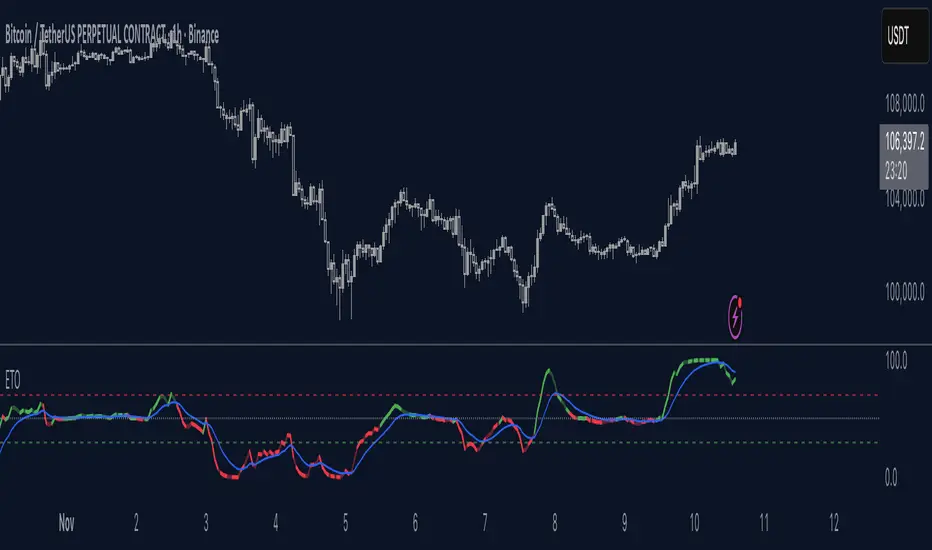
The Elastic Trend Oscillator (ETO) is a volatility-adaptive momentum indicator that measures price displacement from a trend baseline while accounting for market volatility conditions. Unlike traditional oscillators that use fixed scaling, ETO dynamically adjusts its sensitivity based on current volatility levels relative to recent market conditions, providing context-aware momentum readings across different market regimes.
What Makes This Indicator Different
Volatility-Adaptive Scaling:
The core innovation of ETO is its dynamic volatility adjustment mechanism. The indicator calculates an ATR percentile rank over a lookback period and uses this to scale the momentum readings. When volatility is elevated, the indicator becomes less sensitive to price moves, recognizing that larger displacements are normal in volatile conditions. Conversely, in low volatility environments, smaller price moves are given more weight. This prevents false signals during volatility expansions and maintains sensitivity during quiet periods.
Low Volatility Compression:
During periods of extremely low volatility, the oscillator naturally compresses toward the midline and exhibits minimal movement. This midline-hugging behavior serves as a visual indicator that the market lacks directional energy and momentum readings are unreliable. Unlike indicators that continue oscillating during quiet periods and potentially generate false signals, ETO's compression around the midline is supposed to identify low-conviction environments where trend-following strategies underperform. When you see the oscillator stuck near 50 with little movement, recognize this as a consolidation phase where ranges dominate and breakout setups may be developing.

Trend Slope Analysis with Dynamic Thresholds:
The indicator monitors both the trend direction (EMA slope) and the rate of slope change. Dynamic thresholds based on ATR identify when trend acceleration is slowing. The oscillator becomes semi-transparent when slope deceleration exceeds the threshold, warning of potential trend exhaustion before actual reversals occur.

Relatively Linear Transformation:
Unlike many oscillators that use non-linear transformations, ETO applies a more linear scaling of the ATR-normalized displacement. This preserves the proportional relationship between price moves and oscillator readings, making divergences and momentum shifts more intuitive to interpret.
How to Use the Indicator
Trend Direction:
Green oscillator = Bullish trend (price above EMA with positive slope)
Red oscillator = Bearish trend (price below EMA with negative slope)
Oscillator compressed near 50 with minimal movement = Low volatility, consolidation phase. These phases often precede volatility expansions and significant directional moves, making them more ideal for monitoring breakout setups rather than taking positions.
Momentum Quality:
Solid color = Strong, accelerating trend
Semi-transparent = Decelerating trend, potential exhaustion, potential consolidation ahead
The transparency change acts as an early warning before actual trend reversals or consolidations.
Trading Signals:
Crossovers: When the oscillator crosses the signal line to the other side of momentum while oversold/overbought, it suggests potential reversals (better in combination with transparency loss).

Overbought/Oversold: Levels above 70 indicate overbought conditions; below 30 indicate oversold. These are not reversal signals themselves but identify extended moves where momentum may be extreme.
Midline: Oscillator above 50 indicates price is above the trend baseline with positive displacement. Below 50 indicates negative displacement.

Divergences: Like with other momentum indicators compare oscillator highs/lows with price highs/lows.


Settings
EMA Length: Controls the trend baseline period. Lower values make the indicator more responsive to short-term price changes; higher values focus on longer-term trends. This directly affects how quickly the oscillator responds to trend changes.
ATR Length: Determines the period for volatility measurement. This affects both the normalization of price displacement and the momentum confirmation filter. Lower values make volatility measurements more reactive; higher values provide smoother volatility assessment.
Oscillator Smoothing: Applies EMA smoothing to the raw oscillator values. A value of 1 shows unsmoothed, more volatile readings. Higher values produce smoother oscillations with less noise but more lag.
Signal Line Length: The EMA period for the signal line. Lower values create more frequent crossovers; higher values generate fewer but potentially more significant crossovers. This acts as a moving average of the oscillator itself.
Slope Change Sensitivity: Multiplier that sets how much slope deceleration triggers the transparency effect. Lower values make the indicator more sensitive to trend exhaustion, showing transparency earlier. Higher values require more pronounced deceleration before visual warning.
Overbought Level: Defines the upper extreme threshold.
Oversold Level: Defines the lower extreme threshold.
Best Practices
Use on any timeframe, but adjust EMA and ATR lengths according to your trading style (shorter for shorter term trades, longer for longer term trading like swing trading)
Combine with price action — the indicator identifies momentum conditions, not specific entry/exit points.
In strongly trending markets, the oscillator may remain in overbought/oversold territory for extended periods—this is normal and indicates persistent momentum rather than imminent reversal.
This indicator does not provide investment or trading advice. All trading decisions should be made based on your own analysis and risk management.
What Makes This Indicator Different
Volatility-Adaptive Scaling:
The core innovation of ETO is its dynamic volatility adjustment mechanism. The indicator calculates an ATR percentile rank over a lookback period and uses this to scale the momentum readings. When volatility is elevated, the indicator becomes less sensitive to price moves, recognizing that larger displacements are normal in volatile conditions. Conversely, in low volatility environments, smaller price moves are given more weight. This prevents false signals during volatility expansions and maintains sensitivity during quiet periods.
Low Volatility Compression:
During periods of extremely low volatility, the oscillator naturally compresses toward the midline and exhibits minimal movement. This midline-hugging behavior serves as a visual indicator that the market lacks directional energy and momentum readings are unreliable. Unlike indicators that continue oscillating during quiet periods and potentially generate false signals, ETO's compression around the midline is supposed to identify low-conviction environments where trend-following strategies underperform. When you see the oscillator stuck near 50 with little movement, recognize this as a consolidation phase where ranges dominate and breakout setups may be developing.
Trend Slope Analysis with Dynamic Thresholds:
The indicator monitors both the trend direction (EMA slope) and the rate of slope change. Dynamic thresholds based on ATR identify when trend acceleration is slowing. The oscillator becomes semi-transparent when slope deceleration exceeds the threshold, warning of potential trend exhaustion before actual reversals occur.
Relatively Linear Transformation:
Unlike many oscillators that use non-linear transformations, ETO applies a more linear scaling of the ATR-normalized displacement. This preserves the proportional relationship between price moves and oscillator readings, making divergences and momentum shifts more intuitive to interpret.
How to Use the Indicator
Trend Direction:
Green oscillator = Bullish trend (price above EMA with positive slope)
Red oscillator = Bearish trend (price below EMA with negative slope)
Oscillator compressed near 50 with minimal movement = Low volatility, consolidation phase. These phases often precede volatility expansions and significant directional moves, making them more ideal for monitoring breakout setups rather than taking positions.
Momentum Quality:
Solid color = Strong, accelerating trend
Semi-transparent = Decelerating trend, potential exhaustion, potential consolidation ahead
The transparency change acts as an early warning before actual trend reversals or consolidations.
Trading Signals:
Crossovers: When the oscillator crosses the signal line to the other side of momentum while oversold/overbought, it suggests potential reversals (better in combination with transparency loss).
Overbought/Oversold: Levels above 70 indicate overbought conditions; below 30 indicate oversold. These are not reversal signals themselves but identify extended moves where momentum may be extreme.
Midline: Oscillator above 50 indicates price is above the trend baseline with positive displacement. Below 50 indicates negative displacement.
Divergences: Like with other momentum indicators compare oscillator highs/lows with price highs/lows.
Settings
EMA Length: Controls the trend baseline period. Lower values make the indicator more responsive to short-term price changes; higher values focus on longer-term trends. This directly affects how quickly the oscillator responds to trend changes.
ATR Length: Determines the period for volatility measurement. This affects both the normalization of price displacement and the momentum confirmation filter. Lower values make volatility measurements more reactive; higher values provide smoother volatility assessment.
Oscillator Smoothing: Applies EMA smoothing to the raw oscillator values. A value of 1 shows unsmoothed, more volatile readings. Higher values produce smoother oscillations with less noise but more lag.
Signal Line Length: The EMA period for the signal line. Lower values create more frequent crossovers; higher values generate fewer but potentially more significant crossovers. This acts as a moving average of the oscillator itself.
Slope Change Sensitivity: Multiplier that sets how much slope deceleration triggers the transparency effect. Lower values make the indicator more sensitive to trend exhaustion, showing transparency earlier. Higher values require more pronounced deceleration before visual warning.
Overbought Level: Defines the upper extreme threshold.
Oversold Level: Defines the lower extreme threshold.
Best Practices
Use on any timeframe, but adjust EMA and ATR lengths according to your trading style (shorter for shorter term trades, longer for longer term trading like swing trading)
Combine with price action — the indicator identifies momentum conditions, not specific entry/exit points.
In strongly trending markets, the oscillator may remain in overbought/oversold territory for extended periods—this is normal and indicates persistent momentum rather than imminent reversal.
This indicator does not provide investment or trading advice. All trading decisions should be made based on your own analysis and risk management.
Skrypt chroniony
Ten skrypt został opublikowany jako zamknięty kod źródłowy. Można z tego korzystać swobodnie i bez żadnych ograniczeń — więcej informacji znajduje się tutaj.
Wyłączenie odpowiedzialności
Informacje i publikacje nie stanowią i nie powinny być traktowane jako porady finansowe, inwestycyjne, tradingowe ani jakiekolwiek inne rekomendacje dostarczane lub zatwierdzone przez TradingView. Więcej informacji znajduje się w Warunkach użytkowania.