OPEN-SOURCE SCRIPT
Bollinger OTT Spread
Bollinger OTT Spread (BOOTS) is a development combining Bollinger Bands with Optimized Trend Tracker (OTT) Indicator by Anıl Özekşi.
Bollinger Bands have originally 3 lines: Simple Moving Average (Middle Line), Upper Band and Lower Band.
BOOTS concentrates on the upper and lower Bollinger band lines.
First, it calculates the OTT using the UPPER and LOWER Bollinger Bands in a period of time (default lengths are 2) instead of closing prices.
After that, Upper and lower bands have more constant values.
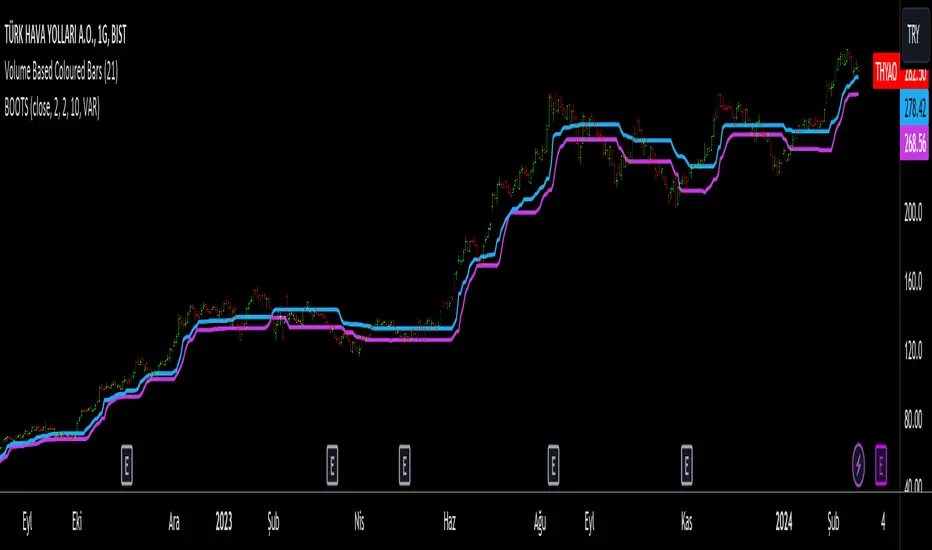
There are 2 lines in BOOTS:
-The top (cyan) line is originally an OTT of the Upper Bollinger Band. (BOOTShigh)
-The bottom line (purple) is also an OTT line but conversely uses Lower Bollinger Band in the same period. (BOOTSlow)
Default values:
Bollinger Bands Moving AveragePeriod: 2 Bars
OTT Length: 2 Bars
OTT Optimizing coefficient (percent): %10
Bollinger Bands Standart Deviation Multiplier: 2 (not adjustable)
These values are designed for daily time frame, so they have to be optimized in other timeframes by the user. (Ex: Higher values can be considered in lower time frames)
Originally, Bollinger Bands used a Simple Moving Average in their calculation, but this time, Anıl Özekşi prefers VIDYA (Variable Dynamic Moving Average = VAR) instead of a Simple Moving Average.
Bollinger Bands cannot create significant BUY & SELL signals considering their original logic, but the primary purpose of BOOTS is to have substantial trading signals:
BUY when the price crosses above the BOOTSLower line (purple line)
STOP when the price crosses back below the BOOTSLower line (purple line)
SELL when the price crosses below the BOOTSUpper line (cyan line)
STOP when the price crosses back above the BOOTSUpper line (cyan line)
The price zone between the two lines is the flat zone; traders don't consider taking new positions in that area between the two lines.
Developer Anıl Özekşi advises that traders may have more accurate signals when using a short-period moving average instead of closing prices. So, I added a moving average with the same default length of 2 , which was used in Bollinger Bands calculation. You can check the "SHOW MOVING AVERAGE?" box on the settings tab of the indicator.
Bollinger Bands have originally 3 lines: Simple Moving Average (Middle Line), Upper Band and Lower Band.
BOOTS concentrates on the upper and lower Bollinger band lines.
First, it calculates the OTT using the UPPER and LOWER Bollinger Bands in a period of time (default lengths are 2) instead of closing prices.
After that, Upper and lower bands have more constant values.
There are 2 lines in BOOTS:
-The top (cyan) line is originally an OTT of the Upper Bollinger Band. (BOOTShigh)
-The bottom line (purple) is also an OTT line but conversely uses Lower Bollinger Band in the same period. (BOOTSlow)
Default values:
Bollinger Bands Moving AveragePeriod: 2 Bars
OTT Length: 2 Bars
OTT Optimizing coefficient (percent): %10
Bollinger Bands Standart Deviation Multiplier: 2 (not adjustable)
These values are designed for daily time frame, so they have to be optimized in other timeframes by the user. (Ex: Higher values can be considered in lower time frames)
Originally, Bollinger Bands used a Simple Moving Average in their calculation, but this time, Anıl Özekşi prefers VIDYA (Variable Dynamic Moving Average = VAR) instead of a Simple Moving Average.
Bollinger Bands cannot create significant BUY & SELL signals considering their original logic, but the primary purpose of BOOTS is to have substantial trading signals:
BUY when the price crosses above the BOOTSLower line (purple line)
STOP when the price crosses back below the BOOTSLower line (purple line)
SELL when the price crosses below the BOOTSUpper line (cyan line)
STOP when the price crosses back above the BOOTSUpper line (cyan line)
The price zone between the two lines is the flat zone; traders don't consider taking new positions in that area between the two lines.
Developer Anıl Özekşi advises that traders may have more accurate signals when using a short-period moving average instead of closing prices. So, I added a moving average with the same default length of 2 , which was used in Bollinger Bands calculation. You can check the "SHOW MOVING AVERAGE?" box on the settings tab of the indicator.
Skrypt open-source
W prawdziwym duchu TradingView autor tego skryptu opublikował go jako open source, aby inwestorzy mogli go zrozumieć i zweryfikować. Pozdrowienia dla autora! Możesz go używać bezpłatnie, ale ponowne użycie tego kodu w publikacji podlega Zasadom Regulaminu. Możesz go oznaczyć jako ulubione, aby użyć go na wykresie.
Telegram t.me/AlgoRhytm
YouTube (Turkish): youtube.com/c/kivancozbilgic
YouTube (English): youtube.com/c/AlgoWorld
YouTube (Turkish): youtube.com/c/kivancozbilgic
YouTube (English): youtube.com/c/AlgoWorld
Wyłączenie odpowiedzialności
Informacje i publikacje przygotowane przez TradingView lub jego użytkowników, prezentowane na tej stronie, nie stanowią rekomendacji ani porad handlowych, inwestycyjnych i finansowych i nie powinny być w ten sposób traktowane ani wykorzystywane. Więcej informacji na ten temat znajdziesz w naszym Regulaminie.