OPEN-SOURCE SCRIPT
Zaktualizowano Fisher Multi-Pack [DW]
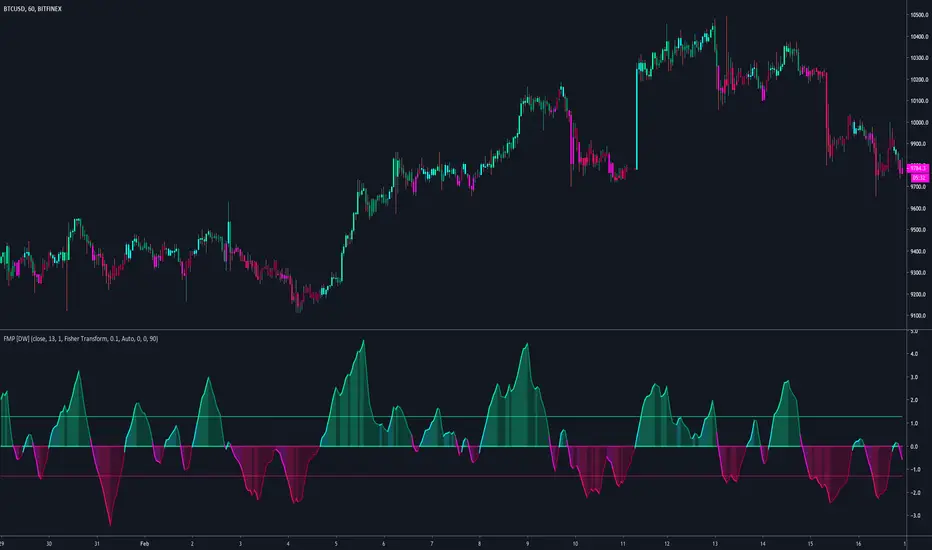
This is an experimental study designed to visualize price activity using John Ehlers Fisher Transform and Inverse Fisher Transform methods.
The Ehlers Fisher Transform is a variation of R. A. Fisher's Z transformation.
In this study, there are five oscillator types to choose from:
-Fisher Transform Indicator - A conversion of price's probability distribution to a Gaussian normal distribution with a smoother output
-Inverse Fisher Relative Strength Index - Converts the RSI's distribution to a bounded distribution between 1 and -1 with a smoother output
-Inverse Fisher Stochastic Oscillator - Converts the Stochastic's distribution to a bounded distribution between 1 and -1 with a smoother output
-Inverse Fisher Commodity Channel Index - Converts the CCI's distribution to a bounded distribution between 1 and -1 with a smoother output
-Inverse Fisher Blast Off Momentum - Converts the BOM's distribution to a bounded distribution between 1 and -1 with a smoother output
The study uses a modified set of Bollinger Bands applied to the chosen oscillator to determine trend and impulse activity, which are highlighted by the color scheme.
Custom bar colors are included.
Informacje o Wersji
Updates:Cleaned up the script. Removed clutter.
Removed Inverse Fisher BOM from the oscillator types due to an excessive amount of false readings.
Thresholds are no longer Bollinger Bands. Instead, they are calculated using a cumulative average of the oscillator's deviation from 0.
Minor aesthetic changes.
Informacje o Wersji
Updates:-> Reorganized script structure.
-> Main calculations are now expressed as functions.
-> Added custom threshold inputs.
-> Added an option to compress the oscillator around thresholds by a specified level of intensity. (Most useful with Fisher Transform oscillator type.)
-> Revamped color scheme.
Skrypt open-source
W zgodzie z duchem TradingView twórca tego skryptu udostępnił go jako open-source, aby użytkownicy mogli przejrzeć i zweryfikować jego działanie. Ukłony dla autora. Korzystanie jest bezpłatne, jednak ponowna publikacja kodu podlega naszym Zasadom serwisu.
For my full list of premium tools, check the blog:
wallanalytics.com/
Reach out on Telegram:
t.me/DonovanWall
wallanalytics.com/
Reach out on Telegram:
t.me/DonovanWall
Wyłączenie odpowiedzialności
Informacje i publikacje nie stanowią i nie powinny być traktowane jako porady finansowe, inwestycyjne, tradingowe ani jakiekolwiek inne rekomendacje dostarczane lub zatwierdzone przez TradingView. Więcej informacji znajduje się w Warunkach użytkowania.