OPEN-SOURCE SCRIPT
Zaktualizowano Daily Bubble Risk Adjustment

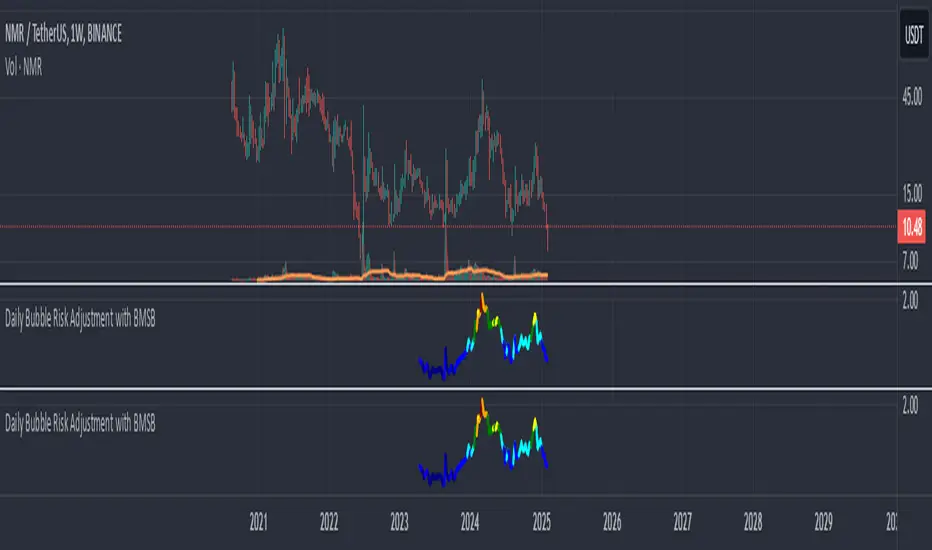
This script calculates the ratio of the asset's closing price to its 20-week moving average (20W MA) and visualizes it as a color-coded line chart. The script also includes a customizable moving average (default: 111-day MA) to help smooth the ratio trend.
It identifies overbought and oversold conditions relative to the 20W MA, making it a valuable tool for long-term trend analysis.
It identifies overbought and oversold conditions relative to the 20W MA, making it a valuable tool for long-term trend analysis.
Informacje o Wersji
This script calculates the ratio of the asset's closing price to its 20-week moving average (20W MA) and visualizes it as a color-coded line chart. The script also includes a customizable moving average (default: 111-day MA) to help smooth the ratio trend.It identifies overbought and oversold conditions relative to the 20W MA, making it a valuable tool for long-term trend analysis.
Informacje o Wersji
Key Updates:BMSB Implementation:
Added 20-SMA and 21-EMA calculations based on the ratio instead of price.
Introduced a shaded area between the two for better visualization.
Revised Color Assignments:
Adjusted the color gradient for different ratio ranges.
Improved color contrast for better readability.
Divergence Detection:
Implemented regular bullish and bearish divergences using pivot points.
Added labels and markers for easier trend identification.
Informacje o Wersji
some adjustments for colorsSkrypt open-source
W zgodzie z duchem TradingView twórca tego skryptu udostępnił go jako open-source, aby użytkownicy mogli przejrzeć i zweryfikować jego działanie. Ukłony dla autora. Korzystanie jest bezpłatne, jednak ponowna publikacja kodu podlega naszym Zasadom serwisu.
Wyłączenie odpowiedzialności
Informacje i publikacje nie stanowią i nie powinny być traktowane jako porady finansowe, inwestycyjne, tradingowe ani jakiekolwiek inne rekomendacje dostarczane lub zatwierdzone przez TradingView. Więcej informacji znajduje się w Warunkach użytkowania.
Skrypt open-source
W zgodzie z duchem TradingView twórca tego skryptu udostępnił go jako open-source, aby użytkownicy mogli przejrzeć i zweryfikować jego działanie. Ukłony dla autora. Korzystanie jest bezpłatne, jednak ponowna publikacja kodu podlega naszym Zasadom serwisu.
Wyłączenie odpowiedzialności
Informacje i publikacje nie stanowią i nie powinny być traktowane jako porady finansowe, inwestycyjne, tradingowe ani jakiekolwiek inne rekomendacje dostarczane lub zatwierdzone przez TradingView. Więcej informacji znajduje się w Warunkach użytkowania.