OPEN-SOURCE SCRIPT
Dual Strength RSI
Dual Strength RSI Indicator
Republished: The original script violated house rules by including an external link to Backtest Rookies.
Background
This is a simple indicator was designed as part of a tutorial on the Backtest-Rookies website.
Logic
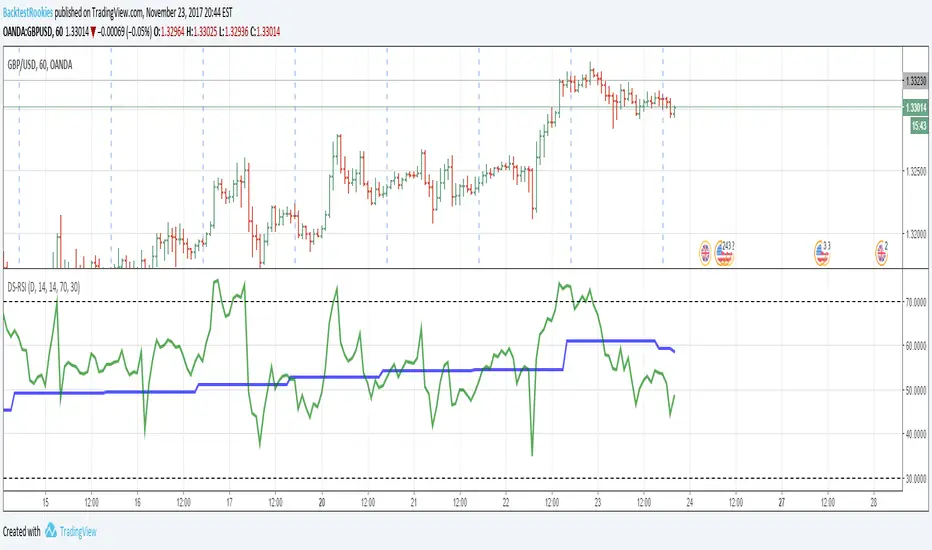
The indicator will plot RSI values from 2 timeframes. The first plotted line will be the current timeframe and the second line will be a user selected timeframe. The theory is that if the instrument is overbought / oversold on two timeframes at the same time, it might be more likely to reverse or revert to the mean.
As with most oscillating indicators, this will likely be most suitable for ranging market conditions.
Examples


Republished: The original script violated house rules by including an external link to Backtest Rookies.
Background
This is a simple indicator was designed as part of a tutorial on the Backtest-Rookies website.
Logic
The indicator will plot RSI values from 2 timeframes. The first plotted line will be the current timeframe and the second line will be a user selected timeframe. The theory is that if the instrument is overbought / oversold on two timeframes at the same time, it might be more likely to reverse or revert to the mean.
As with most oscillating indicators, this will likely be most suitable for ranging market conditions.
Examples
Skrypt open-source
W zgodzie z duchem TradingView twórca tego skryptu udostępnił go jako open-source, aby użytkownicy mogli przejrzeć i zweryfikować jego działanie. Ukłony dla autora. Korzystanie jest bezpłatne, jednak ponowna publikacja kodu podlega naszym Zasadom serwisu.
Wyłączenie odpowiedzialności
Informacje i publikacje nie stanowią i nie powinny być traktowane jako porady finansowe, inwestycyjne, tradingowe ani jakiekolwiek inne rekomendacje dostarczane lub zatwierdzone przez TradingView. Więcej informacji znajduje się w Warunkach użytkowania.