OPEN-SOURCE SCRIPT
High and Low with Horizontal Table
High and Low with Horizontal Table Indicator
Overview
The "High and Low with Horizontal Table" indicator is designed for traders who wish to monitor key levels based on specific candle times, along with dynamic risk-to-reward ratios and ATR-based values. This indicator features real-time calculations, visual cues, and a table for quick reference of the calculated values.
Key Features
Custom Time Inputs:
Users can define two specific time inputs to select the candles for the High and Low prices. These times can target the same or separate candles.
ATR-based Calculation:
The indicator allows users to apply an ATR Multiplier to adjust the calculation of key levels. By default, the ATR multiplier is set to 1.2, but users can adjust it to their preferred value (e.g., 1.5 or 2).
Risk-to-Reward (R:R) Calculation:
The Risk-to-Reward Ratio (R:R) is used to calculate potential Take Profit (TP) levels based on the high and low of the selected candle(s).
The default R:R ratio is 2.0, but it can be customized to suit the trader’s strategy.
Visual Markings:
The High and Low values are plotted with subtle markers on the chart (cross style) for easy identification. The display of these markers is subdued for minimal visual distraction.
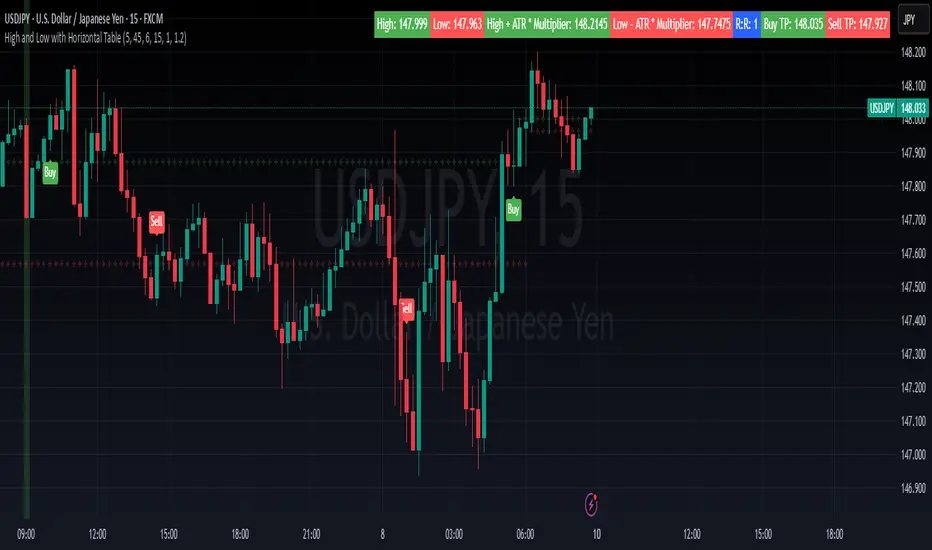
Horizontal Table Display:
A horizontal table is generated in the top-right corner of the chart, providing a quick reference for the following values:
High and Low of the selected candle(s)
High + ATR Multiplier and Low - ATR Multiplier
R:R ratio
Buy TP and Sell TP levels
Each value is displayed with a reasonable number of decimal places (4 decimals) for major forex pairs, XAUUSD, and BTCUSD.
Input Parameters
Hour and Minute for High Candle: Select the time for the candle that will determine the High.
Hour and Minute for Low Candle: Select the time for the candle that will determine the Low.
ATR Multiplier: A customizable input for adjusting the ATR-based calculations (default is 1.2).
Risk-to-Reward (R:R): Set the ratio to determine the TP levels (default is 2.0).
How It Works
The user defines two distinct time inputs (one for the High and one for the Low).
At the specified times, the indicator captures the High and Low prices of the candles.
The ATR is calculated and adjusted by the user-defined ATR Multiplier to determine buffers above the High and below the Low.
The Risk-to-Reward ratio is applied to calculate the Take Profit levels.
All of these values are displayed on the chart and updated in real time. The horizontal table ensures quick reference to all the key levels without cluttering the main chart.
Use Cases
Trend Trading: Identify potential support and resistance levels based on specific timeframes and adjust TP targets using ATR.
Scalping: Use the ATR and R:R calculations to target precise entry and exit points.
Market Opens: Track key market opens (such as New York and London) with candle times that reflect your trading strategy.
Conclusion
The High and Low with Horizontal Table indicator is a powerful tool for traders looking to combine precise candle-based level tracking with ATR-based risk management. By displaying key levels and TP targets in a clear, tabular format, traders can quickly assess and act on key price levels throughout their trading sessions.
Overview
The "High and Low with Horizontal Table" indicator is designed for traders who wish to monitor key levels based on specific candle times, along with dynamic risk-to-reward ratios and ATR-based values. This indicator features real-time calculations, visual cues, and a table for quick reference of the calculated values.
Key Features
Custom Time Inputs:
Users can define two specific time inputs to select the candles for the High and Low prices. These times can target the same or separate candles.
ATR-based Calculation:
The indicator allows users to apply an ATR Multiplier to adjust the calculation of key levels. By default, the ATR multiplier is set to 1.2, but users can adjust it to their preferred value (e.g., 1.5 or 2).
Risk-to-Reward (R:R) Calculation:
The Risk-to-Reward Ratio (R:R) is used to calculate potential Take Profit (TP) levels based on the high and low of the selected candle(s).
The default R:R ratio is 2.0, but it can be customized to suit the trader’s strategy.
Visual Markings:
The High and Low values are plotted with subtle markers on the chart (cross style) for easy identification. The display of these markers is subdued for minimal visual distraction.
Horizontal Table Display:
A horizontal table is generated in the top-right corner of the chart, providing a quick reference for the following values:
High and Low of the selected candle(s)
High + ATR Multiplier and Low - ATR Multiplier
R:R ratio
Buy TP and Sell TP levels
Each value is displayed with a reasonable number of decimal places (4 decimals) for major forex pairs, XAUUSD, and BTCUSD.
Input Parameters
Hour and Minute for High Candle: Select the time for the candle that will determine the High.
Hour and Minute for Low Candle: Select the time for the candle that will determine the Low.
ATR Multiplier: A customizable input for adjusting the ATR-based calculations (default is 1.2).
Risk-to-Reward (R:R): Set the ratio to determine the TP levels (default is 2.0).
How It Works
The user defines two distinct time inputs (one for the High and one for the Low).
At the specified times, the indicator captures the High and Low prices of the candles.
The ATR is calculated and adjusted by the user-defined ATR Multiplier to determine buffers above the High and below the Low.
The Risk-to-Reward ratio is applied to calculate the Take Profit levels.
All of these values are displayed on the chart and updated in real time. The horizontal table ensures quick reference to all the key levels without cluttering the main chart.
Use Cases
Trend Trading: Identify potential support and resistance levels based on specific timeframes and adjust TP targets using ATR.
Scalping: Use the ATR and R:R calculations to target precise entry and exit points.
Market Opens: Track key market opens (such as New York and London) with candle times that reflect your trading strategy.
Conclusion
The High and Low with Horizontal Table indicator is a powerful tool for traders looking to combine precise candle-based level tracking with ATR-based risk management. By displaying key levels and TP targets in a clear, tabular format, traders can quickly assess and act on key price levels throughout their trading sessions.
Skrypt open-source
W zgodzie z duchem TradingView twórca tego skryptu udostępnił go jako open-source, aby użytkownicy mogli przejrzeć i zweryfikować jego działanie. Ukłony dla autora. Korzystanie jest bezpłatne, jednak ponowna publikacja kodu podlega naszym Zasadom serwisu.
Wyłączenie odpowiedzialności
Informacje i publikacje nie stanowią i nie powinny być traktowane jako porady finansowe, inwestycyjne, tradingowe ani jakiekolwiek inne rekomendacje dostarczane lub zatwierdzone przez TradingView. Więcej informacji znajduje się w Warunkach użytkowania.