OPEN-SOURCE SCRIPT
EMA/SMA Full color signal candles
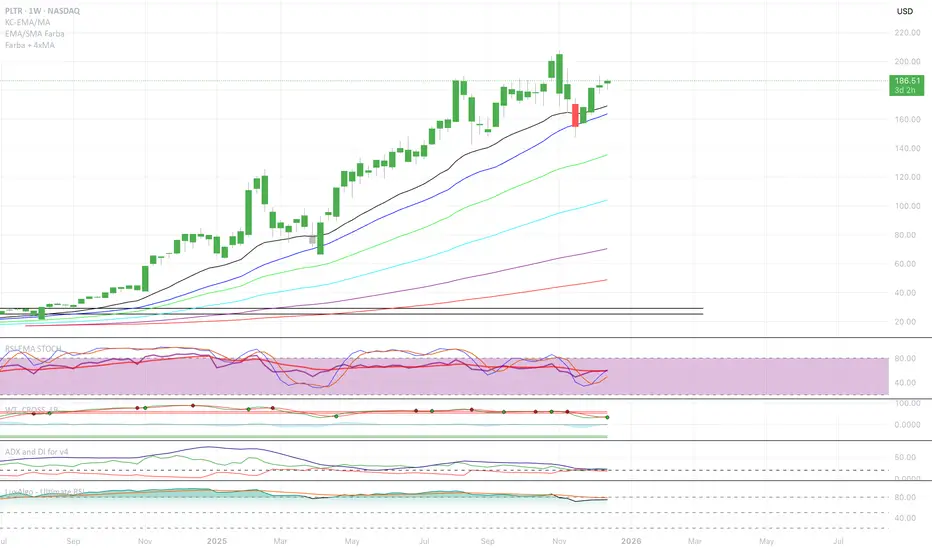
💡 What It Does:
The indicator calculates and plots the 21-period Exponential Moving Average (EMA) and the 30-period Simple Moving Average (SMA). It then analyzes the closing price of each candle and colors the entire candlestick (body and border) according to pre-defined trend conditions.
This visualization allows traders to identify strong trend environments versus periods of consolidation or indecision at a glance, removing the need to constantly check the price relationship manually.
🎨 Color Conditions and Meaning:
The indicator uses three distinct color states to signal the market's current momentum:
Color,Condition,Market Interpretation
🟢 GREEN,Closing Price is ABOVE both the 21 EMA AND the 30 SMA.,Strong Bullish Trend: Suggests high momentum and confirmation of an uptrend. Ideal for long bias.
🔴 RED,Closing Price is BELOW both the 21 EMA AND the 30 SMA.,Strong Bearish Trend: Suggests high downward pressure and confirmation of a downtrend. Ideal for short bias.
⚫ GRAY,"Closing Price is in any other state (e.g., between the two MAs, or under one and over the other).","Neutral / Consolidation: Indicates uncertainty, low momentum, or potential trend exhaustion/reversal. Caution is advised."
🔧 Customization Options:The indicator is fully customizable, allowing users to fine-tune the periods to match their preferred trading style (e.g., scalping, swing trading).Dĺžka EMA (Length EMA): Allows you to change the period for the Exponential Moving Average (default is 21).Dĺžka SMA (Length SMA): Allows you to change the period for the Simple Moving Average (default is 30).
I added also Extra 4 EMA lines to have extra edge.
Skrypt open-source
W zgodzie z duchem TradingView twórca tego skryptu udostępnił go jako open-source, aby użytkownicy mogli przejrzeć i zweryfikować jego działanie. Ukłony dla autora. Korzystanie jest bezpłatne, jednak ponowna publikacja kodu podlega naszym Zasadom serwisu.
Wyłączenie odpowiedzialności
Informacje i publikacje nie stanowią i nie powinny być traktowane jako porady finansowe, inwestycyjne, tradingowe ani jakiekolwiek inne rekomendacje dostarczane lub zatwierdzone przez TradingView. Więcej informacji znajduje się w Warunkach użytkowania.