OPEN-SOURCE SCRIPT
Zaktualizowano Z Score
What Is Z-Score?
Z-score is a statistical measurement that describes a value's relationship to the mean of a group of values. Z-score is measured in terms of standard deviations from the mean. If a Z-score is 0, it indicates that the data point's score is identical to the mean score. A Z-score of 1.0 would indicate a value that is one standard deviation from the mean. Z-scores may be positive or negative, with a positive value indicating the score is above the mean and a negative score indicating it is below the mean.
CBOE Volatility Index
VIX is the ticker symbol and the popular name for the Chicago Board Options Exchange's CBOE Volatility Index, a popular measure of the stock market's expectation of volatility based on S&P 500 index options. It is calculated and disseminated on a real-time basis by the CBOE, and is often referred to as the fear index or fear gauge. To summarize, VIX is a volatility index derived from S&P 500 options for the 30 days following the measurement date, with the price of each option representing the market's expectation of 30-day forward-looking volatility. The resulting VIX index formulation provides a measure of expected market volatility on which expectations of further stock market volatility in the near future might be based
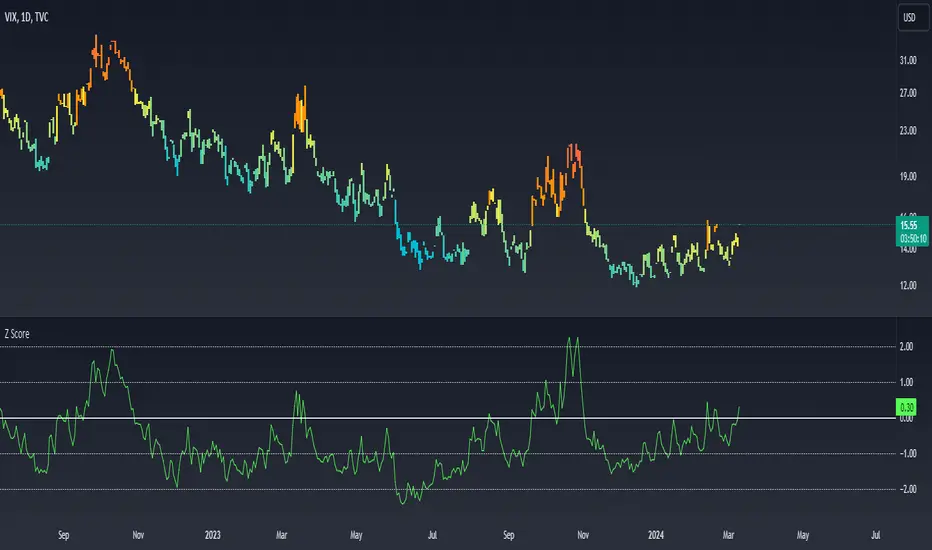
Z Scores of VIX
When the Z-scored VIX indicator exceeds the +2 standard deviation mark, the system forecasts mean reversion and decreasing volatility and the possibility of an upward trend in S&P500.
When the Z-scored VIX indicator falls below -2 standard deviations, the system predicts future increasing volatility and the possibility of a downward trend in S&P500.
Z-score is a statistical measurement that describes a value's relationship to the mean of a group of values. Z-score is measured in terms of standard deviations from the mean. If a Z-score is 0, it indicates that the data point's score is identical to the mean score. A Z-score of 1.0 would indicate a value that is one standard deviation from the mean. Z-scores may be positive or negative, with a positive value indicating the score is above the mean and a negative score indicating it is below the mean.
CBOE Volatility Index
VIX is the ticker symbol and the popular name for the Chicago Board Options Exchange's CBOE Volatility Index, a popular measure of the stock market's expectation of volatility based on S&P 500 index options. It is calculated and disseminated on a real-time basis by the CBOE, and is often referred to as the fear index or fear gauge. To summarize, VIX is a volatility index derived from S&P 500 options for the 30 days following the measurement date, with the price of each option representing the market's expectation of 30-day forward-looking volatility. The resulting VIX index formulation provides a measure of expected market volatility on which expectations of further stock market volatility in the near future might be based
Z Scores of VIX
When the Z-scored VIX indicator exceeds the +2 standard deviation mark, the system forecasts mean reversion and decreasing volatility and the possibility of an upward trend in S&P500.
When the Z-scored VIX indicator falls below -2 standard deviations, the system predicts future increasing volatility and the possibility of a downward trend in S&P500.
Informacje o Wersji
Heat MapSkrypt open-source
W zgodzie z duchem TradingView twórca tego skryptu udostępnił go jako open-source, aby użytkownicy mogli przejrzeć i zweryfikować jego działanie. Ukłony dla autora. Korzystanie jest bezpłatne, jednak ponowna publikacja kodu podlega naszym Zasadom serwisu.
Wyłączenie odpowiedzialności
Informacje i publikacje nie stanowią i nie powinny być traktowane jako porady finansowe, inwestycyjne, tradingowe ani jakiekolwiek inne rekomendacje dostarczane lub zatwierdzone przez TradingView. Więcej informacji znajduje się w Warunkach użytkowania.
Skrypt open-source
W zgodzie z duchem TradingView twórca tego skryptu udostępnił go jako open-source, aby użytkownicy mogli przejrzeć i zweryfikować jego działanie. Ukłony dla autora. Korzystanie jest bezpłatne, jednak ponowna publikacja kodu podlega naszym Zasadom serwisu.
Wyłączenie odpowiedzialności
Informacje i publikacje nie stanowią i nie powinny być traktowane jako porady finansowe, inwestycyjne, tradingowe ani jakiekolwiek inne rekomendacje dostarczane lub zatwierdzone przez TradingView. Więcej informacji znajduje się w Warunkach użytkowania.