OPEN-SOURCE SCRIPT
Dynamic Levels
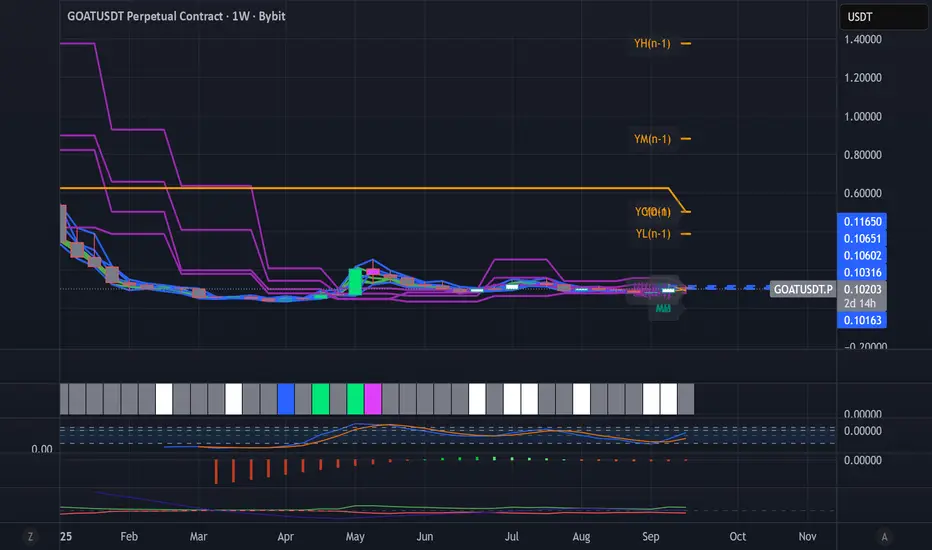
This indicator plots key price levels (Open, High, Low, Mid, Close) from multiple higher timeframes (Monday, Daily, Weekly, Monthly, Yearly).
It allows you to track how price interacts with important reference levels without switching timeframes.
🔑 Features
✅ Monday levels (MO, MH, MM)
By default: shows the last completed Monday (fixed values).
Option: “live mode” to update Monday High/Low/Mid while Monday’s candle is forming.
✅ Daily levels (DO, DH, DL, DM, DC)
Live: Daily High/Low/Mid update dynamically while today’s candle is forming.
Previous Daily Close (DC) is always fixed.
✅ Weekly levels (WO, WH, WL, WM)
Live: Weekly High/Low/Mid update dynamically while this week’s candle is forming.
Weekly Open is fixed.
✅ Monthly levels (MO(n), MH(n-1), ML(n-1), MM(n-1), MC(n-1))
Shows last completed month’s values (constant, never changing).
Current Monthly Open is also shown (naturally fixed).
✅ Yearly levels (YO(n), YH(n-1), YL(n-1), YM(n-1), YC(n-1))
Shows last completed year’s values (constant, never changing).
Current Yearly Open is also shown (naturally fixed).
🎨 Customization
Toggle each level (on/off) in indicator settings.
Individual color settings for Monday, Daily, Weekly, Monthly, and Yearly.
Adjustable line width and transparency.
Optional short labels (MO, DO, WM, etc.) displayed on the right side of the chart.
🔄 Dynamic Logic
Daily and Weekly → update dynamically while their candle is forming.
Monday, Monthly, and Yearly → use fixed values from the last completed bar (do not “breathe”).
📌 Use cases
Quickly see where price stands relative to previous close, current open, or mid-levels.
Use Monday Open/High/Mid as strong intraday references.
Use Monthly/Yearly levels as long-term support/resistance zones.
Skrypt open-source
W zgodzie z duchem TradingView twórca tego skryptu udostępnił go jako open-source, aby użytkownicy mogli przejrzeć i zweryfikować jego działanie. Ukłony dla autora. Korzystanie jest bezpłatne, jednak ponowna publikacja kodu podlega naszym Zasadom serwisu.
Wyłączenie odpowiedzialności
Informacje i publikacje nie stanowią i nie powinny być traktowane jako porady finansowe, inwestycyjne, tradingowe ani jakiekolwiek inne rekomendacje dostarczane lub zatwierdzone przez TradingView. Więcej informacji znajduje się w Warunkach użytkowania.