OPEN-SOURCE SCRIPT
Zaktualizowano Visual RSI
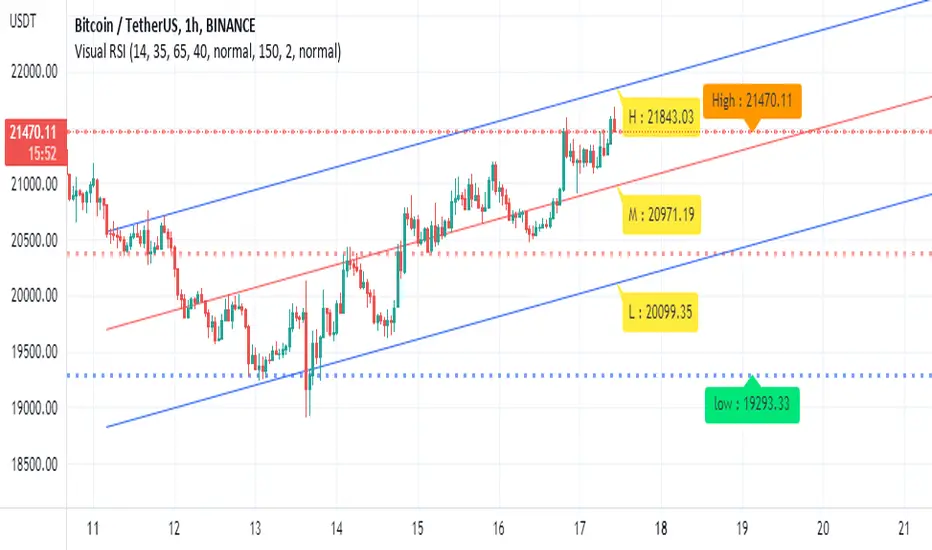
This is a visual format of regular RSI on the screen.
The indicator give you the RSI level for the high and lows and average as well. So it very easy to use it as you normally do with any RSI
buy point are when price reach bellow lower level and start breaking up. sell vice versa
it a concept idea to make our regular RSI more effective for the common user
I hope you like it
1 min chart

15min

The indicator give you the RSI level for the high and lows and average as well. So it very easy to use it as you normally do with any RSI
buy point are when price reach bellow lower level and start breaking up. sell vice versa
it a concept idea to make our regular RSI more effective for the common user
I hope you like it
1 min chart
15min
Informacje o Wersji
add linear regression to make analysis better Skrypt open-source
W zgodzie z duchem TradingView twórca tego skryptu udostępnił go jako open-source, aby użytkownicy mogli przejrzeć i zweryfikować jego działanie. Ukłony dla autora. Korzystanie jest bezpłatne, jednak ponowna publikacja kodu podlega naszym Zasadom serwisu.
Wyłączenie odpowiedzialności
Informacje i publikacje nie stanowią i nie powinny być traktowane jako porady finansowe, inwestycyjne, tradingowe ani jakiekolwiek inne rekomendacje dostarczane lub zatwierdzone przez TradingView. Więcej informacji znajduje się w Warunkach użytkowania.
Skrypt open-source
W zgodzie z duchem TradingView twórca tego skryptu udostępnił go jako open-source, aby użytkownicy mogli przejrzeć i zweryfikować jego działanie. Ukłony dla autora. Korzystanie jest bezpłatne, jednak ponowna publikacja kodu podlega naszym Zasadom serwisu.
Wyłączenie odpowiedzialności
Informacje i publikacje nie stanowią i nie powinny być traktowane jako porady finansowe, inwestycyjne, tradingowe ani jakiekolwiek inne rekomendacje dostarczane lub zatwierdzone przez TradingView. Więcej informacji znajduje się w Warunkach użytkowania.