OPEN-SOURCE SCRIPT
chentz Volume MACD
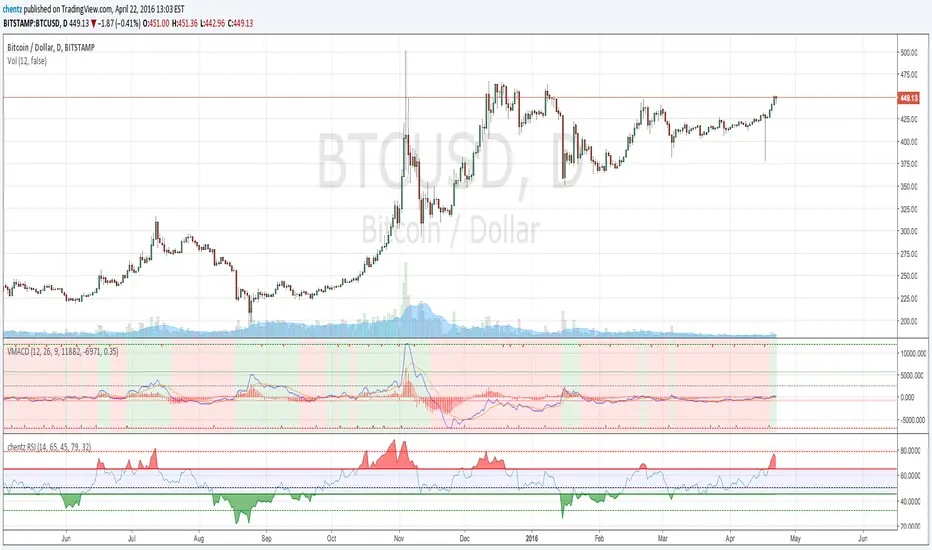
A MACD indicator over the volume to see pattern over the volume.
Adaptation of script from
and using the theoretical foundation from moneyshow.com/articles.asp?aid=daytraders-18013
Adaptation of script from
and using the theoretical foundation from moneyshow.com/articles.asp?aid=daytraders-18013
Skrypt open-source
W zgodzie z duchem TradingView twórca tego skryptu udostępnił go jako open-source, aby użytkownicy mogli przejrzeć i zweryfikować jego działanie. Ukłony dla autora. Korzystanie jest bezpłatne, jednak ponowna publikacja kodu podlega naszym Zasadom serwisu.
Wyłączenie odpowiedzialności
Informacje i publikacje nie stanowią i nie powinny być traktowane jako porady finansowe, inwestycyjne, tradingowe ani jakiekolwiek inne rekomendacje dostarczane lub zatwierdzone przez TradingView. Więcej informacji znajduje się w Warunkach użytkowania.