OPEN-SOURCE SCRIPT
parademi 5-8-13
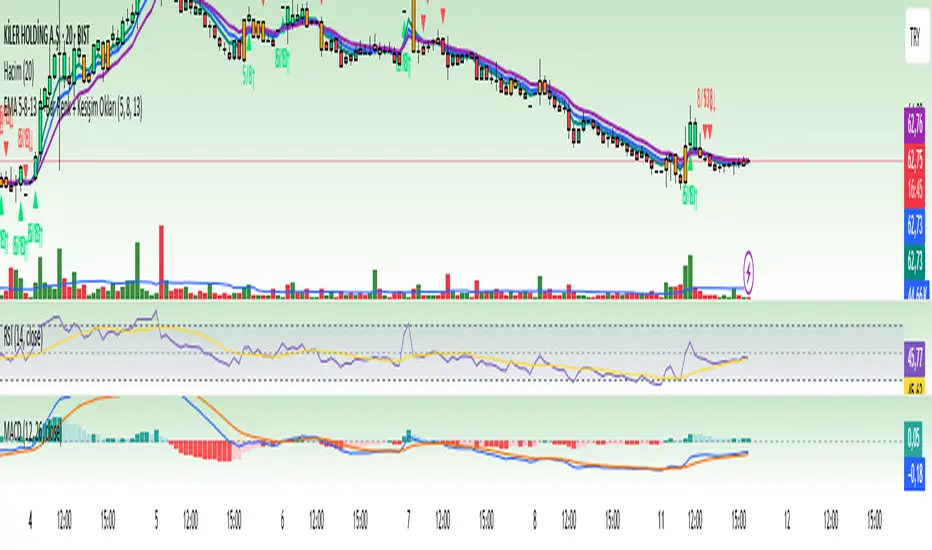
EMA 5-8-13 Trend & Crossover Indicator
This indicator helps you identify market trends and potential reversal points in a single tool. It uses three Exponential Moving Averages (EMA 5, EMA 8, and EMA 13) to determine trend direction and highlight important crossover signals.
Features:
Trend Detection:
When the price is above all three EMAs (5, 8, and 13), candles are colored green, indicating a strong uptrend.
When the price crosses EMA 8, candles turn orange, signaling a possible short-term change in momentum.
Crossover Signals:
When EMA 5 crosses above EMA 8, a green arrow appears below the candle, suggesting a potential buy signal.
When EMA 5 crosses below EMA 8, a red arrow appears above the candle, suggesting a potential sell signal.
Optional EMA 8 and EMA 13 crossover signals can also be displayed using the same logic.
Purpose:
This indicator visually clarifies trend direction and marks potential entry/exit points. It can be used on its own or combined with other technical tools such as volume, support/resistance levels, or momentum indicators for higher accuracy.
Skrypt open-source
W zgodzie z duchem TradingView twórca tego skryptu udostępnił go jako open-source, aby użytkownicy mogli przejrzeć i zweryfikować jego działanie. Ukłony dla autora. Korzystanie jest bezpłatne, jednak ponowna publikacja kodu podlega naszym Zasadom serwisu.
Wyłączenie odpowiedzialności
Informacje i publikacje nie stanowią i nie powinny być traktowane jako porady finansowe, inwestycyjne, tradingowe ani jakiekolwiek inne rekomendacje dostarczane lub zatwierdzone przez TradingView. Więcej informacji znajduje się w Warunkach użytkowania.