OPEN-SOURCE SCRIPT
RSI to Price Ratio
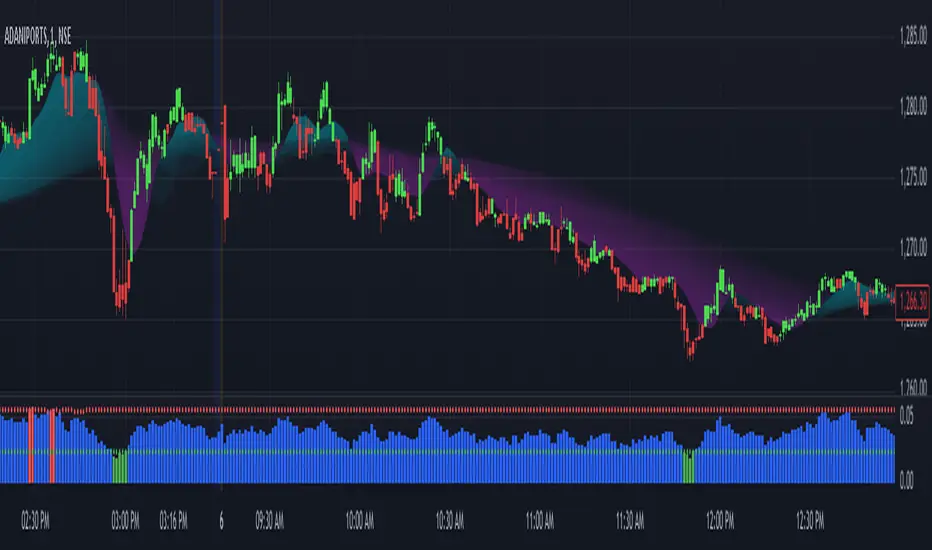
The RSI to Price Ratio is a technical indicator designed to provide traders with a unique perspective by analyzing the relationship between the Relative Strength Index (RSI) and the underlying asset's price. Unlike traditional RSI, which is viewed on a scale from 0 to 100, this indicator normalizes the RSI by dividing it by the price, resulting in a dynamic ratio that adjusts to price movements. The histogram format makes it easy to visualize fluctuations, with distinct color coding for overbought (red), oversold (green), and neutral (blue) conditions.
This indicator excels in helping traders identify potential reversal zones and trend continuation signals. Overbought and oversold levels are dynamically adjusted using the price source, making the indicator more adaptive to market conditions. Additionally, the ability to plot these OB/OS thresholds as lines on the histogram ensures traders can quickly assess whether the market is overstretched in either direction. By combining RSI’s momentum analysis with price normalization, this tool is particularly suited for traders who value precision and nuanced insights into market behavior. It can be used as a standalone indicator or in conjunction with other tools to refine entry and exit strategies.
This indicator excels in helping traders identify potential reversal zones and trend continuation signals. Overbought and oversold levels are dynamically adjusted using the price source, making the indicator more adaptive to market conditions. Additionally, the ability to plot these OB/OS thresholds as lines on the histogram ensures traders can quickly assess whether the market is overstretched in either direction. By combining RSI’s momentum analysis with price normalization, this tool is particularly suited for traders who value precision and nuanced insights into market behavior. It can be used as a standalone indicator or in conjunction with other tools to refine entry and exit strategies.
Skrypt open-source
W zgodzie z duchem TradingView twórca tego skryptu udostępnił go jako open-source, aby użytkownicy mogli przejrzeć i zweryfikować jego działanie. Ukłony dla autora. Korzystanie jest bezpłatne, jednak ponowna publikacja kodu podlega naszym Zasadom serwisu.
Wyłączenie odpowiedzialności
Informacje i publikacje nie stanowią i nie powinny być traktowane jako porady finansowe, inwestycyjne, tradingowe ani jakiekolwiek inne rekomendacje dostarczane lub zatwierdzone przez TradingView. Więcej informacji znajduje się w Warunkach użytkowania.