OPEN-SOURCE SCRIPT
Zaktualizowano MCDX+RSI+SMA[THANHCONG]
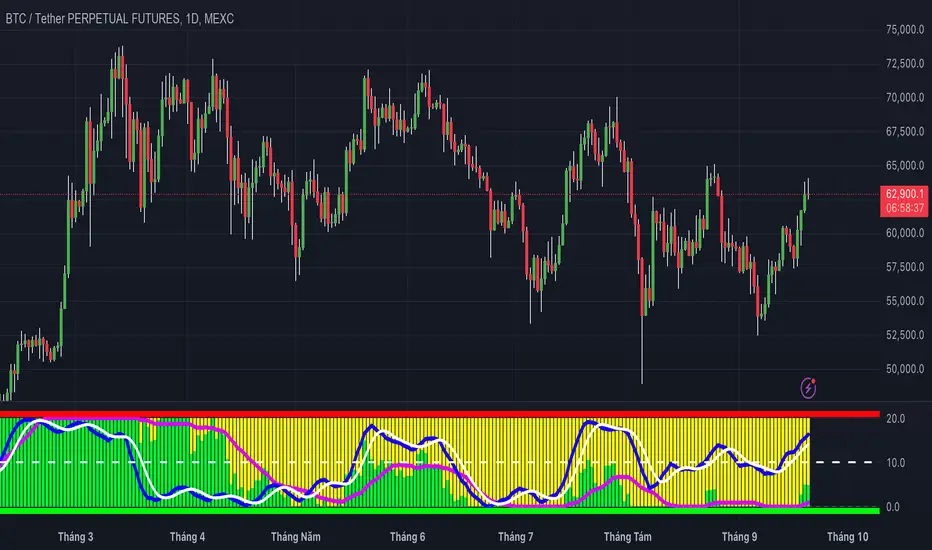
### Detailed Analysis of the MCDX+RSI+SMA Indicator
The MCDX+RSI+SMA indicator is designed to help investors conduct a deeper analysis of market trends by combining multiple technical factors into a single chart. This integration of popular indicators such as RSI, SMA, and Stochastic RSI provides investors with a comprehensive view of market movements, particularly in distinguishing between "Banker" and "Hot Money"—representing large and small capital flows.
#### Key Components of the Indicator:
1. **RSI for Banker and Hot Money:**
- **RSI (Relative Strength Index)** is a momentum oscillator that measures the speed and change of price movements, indicating overbought or oversold conditions. In this indicator, there are two distinct RSI lines configured for Banker (large capital) and Hot Money (small capital).
- Investors can adjust parameters like the RSI calculation period, baseline levels, and sensitivity for each type of capital flow, providing flexibility to adapt to varying market conditions.
2. **Moving Average (MA) of RSI:**
- The indicator employs two common types of Moving Averages: **SMA (Simple Moving Average)** and **EMA (Exponential Moving Average)**. These help smooth the RSI signals for Banker, offering a clearer view of the long-term trend of large capital in the market.
- Investors can select the type and period of the MA, allowing them to optimize the indicator for their trading style.
3. **Stochastic RSI:**
- The **Stochastic RSI** is incorporated to monitor overbought and oversold conditions over a specified timeframe. Parameters related to %K and %D of the Stochastic can also be adjusted to refine the accuracy of market signal analysis.
- A notable feature is the normalization of %K and %D on a 0-20 scale, making these lines compatible with other RSI charts, thus providing consistency in evaluating market strength.
4. **Overbought and Oversold Levels:**
- The indicator includes reference lines for overbought and oversold levels, aiding investors in identifying potential reversal zones in the market. This helps to avoid buying at excessively high prices or selling at excessively low prices.
#### Benefits for Investors:
- **Comprehensive View:** The indicator combines insights from both large (Banker) and small (Hot Money) capital flows, enabling investors to analyze not just trends but also the participation of each type of capital in the market.
- **Enhanced Technical Analysis:** By integrating multiple technical indicators within a single chart, investors can track important factors such as market momentum, overbought/oversold conditions, and capital flow shifts without needing to switch between various charts.
- **Flexibility and Customization:** The indicator allows adjustment of key parameters like the RSI period, sensitivity, type of MA, and Stochastic RSI settings, enabling investors to tailor the indicator to their trading strategy and timeframe.
- **Higher Reliability:** The combination of indicators like RSI, Stochastic RSI, and MA helps investors confirm trading signals more confidently. For instance, when both RSI and Stochastic RSI indicate overbought conditions, the likelihood of a reversal may be higher, reducing risk for investors.
#### Unique Features of the Indicator:
The MCDX+RSI+SMA indicator is a unique tool that integrates various market analysis factors into a single framework. This not only provides investors with a complete view of capital flows but also aids in optimizing decision-making based on multiple market aspects. Furthermore, its customizable parameters make it suitable for various trading strategies, from short-term to long-term.
Informacje o Wersji
Technical Indicator Update:The parameters of the technical indicators have been adjusted to improve system smoothness and provide earlier signals.
Informacje o Wersji
Indicator Update:New Parameters Added:
RSI Length: Adjusts the length of the RSI (Relative Strength Index) indicator.
MFI Length: Adjusts the length of the MFI (Money Flow Index) indicator.
Volume MA Length: Adjusts the length of the moving average for trading volume.
Volume Threshold Percentage: Adds a parameter to adjust the increase or decrease of trading volume compared to the average.
Lookback Period: Adds a parameter to define the period used to calculate peaks and troughs.
Indicator Calculation Updates:
RSI and MFI: RSI and MFI indicators have been added to identify market trends.
Volume Calculation: Adds a calculation for the percentage change in trading volume compared to the moving average.
Money Flow Conditions Updated:
Money Inflow: When RSI, MFI, and trading volume all show positive signals, it's considered money inflow (buy).
Money Outflow: When RSI, MFI, and trading volume all show negative signals, it's considered money outflow (sell).
Peak and Trough Detection:
Adds a feature to identify peaks and troughs on the chart, helping to pinpoint important market levels.
Strong Trend Conditions:
Strong Uptrend: Identified when RSI > 50, MFI > 50, and trading volume increases significantly.
Strong Downtrend: Identified when RSI < 50, MFI < 50, and trading volume decreases significantly.
Money Flow Status Display Table:
A table is created at the bottom of the chart to display the coin's name and money flow status (Buy, Sell, No signal).
Display Features on the Chart:
Peak and Trough: Displays triangle symbols (green) for troughs and triangle symbols (red) for peaks.
Background Color for Strong Trends: The background color will change to display strong trends (green for uptrend, red for downtrend).
Purpose of These Updates:
Identifying Market Trends: With indicators like RSI, MFI, and trading volume, users can assess the current market conditions.
Identifying Potential Buy/Sell Points: Based on money inflow and outflow, this indicator helps users identify potential buying or selling opportunities more effectively.
Providing Detailed and Easy-to-Understand Information: With the table and visual signals (like triangles, background color), users can quickly make informed trading decisions.
Informacje o Wersji
"update with additional characters."Informacje o Wersji
"Update the display of the incoming and outgoing funds indicator.". Informacje o Wersji
New update includes: updated indicator name change.Skrypt open-source
W zgodzie z duchem TradingView twórca tego skryptu udostępnił go jako open-source, aby użytkownicy mogli przejrzeć i zweryfikować jego działanie. Ukłony dla autora. Korzystanie jest bezpłatne, jednak ponowna publikacja kodu podlega naszym Zasadom serwisu.
Wyłączenie odpowiedzialności
Informacje i publikacje nie stanowią i nie powinny być traktowane jako porady finansowe, inwestycyjne, tradingowe ani jakiekolwiek inne rekomendacje dostarczane lub zatwierdzone przez TradingView. Więcej informacji znajduje się w Warunkach użytkowania.
Skrypt open-source
W zgodzie z duchem TradingView twórca tego skryptu udostępnił go jako open-source, aby użytkownicy mogli przejrzeć i zweryfikować jego działanie. Ukłony dla autora. Korzystanie jest bezpłatne, jednak ponowna publikacja kodu podlega naszym Zasadom serwisu.
Wyłączenie odpowiedzialności
Informacje i publikacje nie stanowią i nie powinny być traktowane jako porady finansowe, inwestycyjne, tradingowe ani jakiekolwiek inne rekomendacje dostarczane lub zatwierdzone przez TradingView. Więcej informacji znajduje się w Warunkach użytkowania.