OPEN-SOURCE SCRIPT
Red-Fall% Rebound · Daily Lowest Entry Only [Indicator v6]
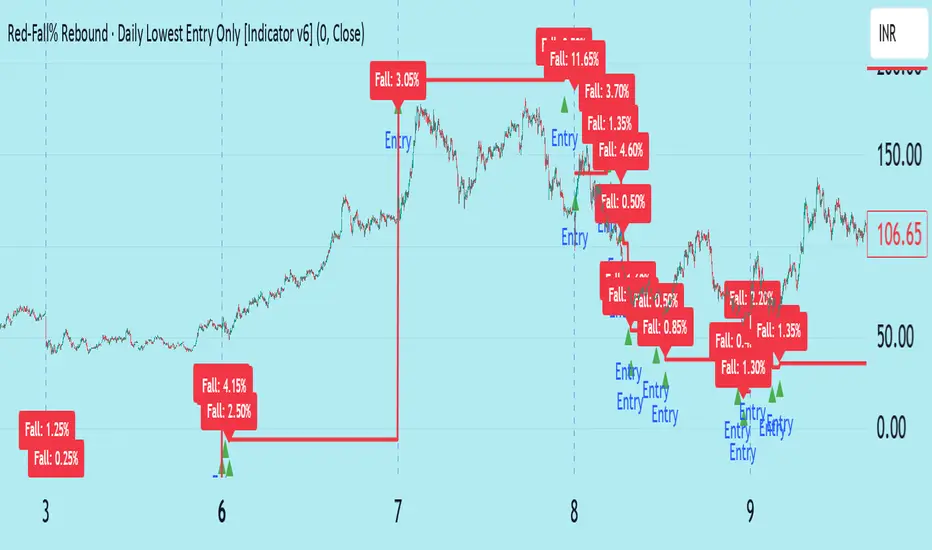
This indicator identifies rebound opportunities following strong bearish (“red”) candles.
It measures the percentage fall of each red candle, then waits for the next candle to cross above its own open price multiplied by that same fall percentage — meaning price has rebounded by the same strength it fell.
Once such a crossover occurs, it’s marked as an entry signal (green triangle).
A label is placed on the previous red candle showing its fall percentage.
Unique Daily Logic:
At the start of each day, the indicator resets its memory.
It saves the first valid entry of the day.
If a later entry appears at a lower price than the first, it replaces the earlier one.
Higher-priced entries the same day are ignored — ensuring only the lowest valid entry per day is highlighted.
Visual Elements:
🔴 Red bar coloring for bearish candles.
🟩 Green triangle under the bar marking the accepted (lowest) entry of the day.
🏷️ Label above the previous red bar showing its percentage fall.
🔻 Optional red line showing a hypothetical stop level based on that fall%.
(No trades are executed — this is purely visual.)
Alerts:
Triggers when a new accepted entry signal appears (i.e., first or lower entry of the day).
You can use this for real-time notifications or automation with webhooks.
Parameters:
Show labels → Toggle fall% labels on/off.
Show stop line → Display/hide the hypothetical stop line.
Minimum fall % → Ignore very small red bars.
Entry price proxy → Choose how the entry level is estimated (Close, Open, or Level = open × (1 + fall%)).
Enable alert condition → Turn alerts on/off.
How to Use:
Add the script to your chart.
Adjust Minimum fall % to focus on significant red bars (e.g., 1–3%).
Watch for green triangles — those are the day’s first or lowest valid rebound entries.
Use the red stop line (optional) as a reference for risk management.
The trade is left open manually — there is no take-profit logic.
Skrypt open-source
W duchu TradingView twórca tego skryptu udostępnił go jako open-source, aby traderzy mogli analizować i weryfikować jego funkcjonalność. Brawo dla autora! Możesz korzystać z niego za darmo, ale pamiętaj, że ponowna publikacja kodu podlega naszym Zasadom Społeczności.
Wyłączenie odpowiedzialności
Informacje i publikacje przygotowane przez TradingView lub jego użytkowników, prezentowane na tej stronie, nie stanowią rekomendacji ani porad handlowych, inwestycyjnych i finansowych i nie powinny być w ten sposób traktowane ani wykorzystywane. Więcej informacji na ten temat znajdziesz w naszym Regulaminie.