OPEN-SOURCE SCRIPT
Zaktualizowano Zarattini Intra-day Threshold Bands (ZITB)
This indicator implements the intraday threshold band methodology described in the research paper by Carlo Zarattini et al.
papers.ssrn.com/sol3/papers.cfm?abstract_id=4824172
Overview:
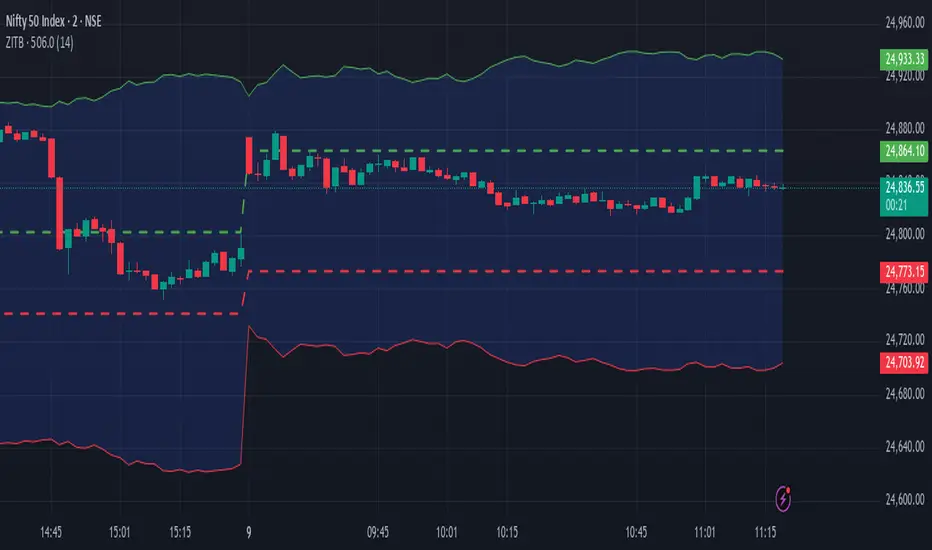
Plots intraday threshold bands based on daily open/close levels.
Supports visualization of BaseUp/BaseDown levels and Threshold Upper/Lower bands.
Optional shading between threshold bands for easier interpretation.
Usage Notes / Limitations:
Originally studied on SPY (US equities), this implementation is adapted for NSE intraday market timing, specifically the NIFTY50 index.
Internally, 2-minute candles are used if the chart timeframe is less than 2 minutes.
Values may be inaccurate if the chart timeframe is more than 1 day.
Lookback days are auto-capped to avoid exceeding TradingView’s 5000-bar limit.
The indicator automatically aligns intraday bars across multiple days to compute average deltas.
For better returns, it is recommended to use this indicator in conjunction with VWAP and a volatility-based position sizing mechanism.
Can be used as a reference for Open Range Breakout (ORB) strategies.
Customizations:
Toggle plotting of base levels and thresholds.
Toggle shading between thresholds.
Line colors and styles can be adjusted in the Style tab.
Author:
Gokul Ramachandran – software architect, engineer, programmer. Interested in trading and investment. Currently trading and researching strategies that can be employed in NSE (Indian market).
Contact: [gokul4trading@gmail.com](mailto:gokul4trading@gmail.com)
LinkedIn: linkedin.com/in/gokulramachandran/
Intended for educational and research purposes only.
papers.ssrn.com/sol3/papers.cfm?abstract_id=4824172
Overview:
Plots intraday threshold bands based on daily open/close levels.
Supports visualization of BaseUp/BaseDown levels and Threshold Upper/Lower bands.
Optional shading between threshold bands for easier interpretation.
Usage Notes / Limitations:
Originally studied on SPY (US equities), this implementation is adapted for NSE intraday market timing, specifically the NIFTY50 index.
Internally, 2-minute candles are used if the chart timeframe is less than 2 minutes.
Values may be inaccurate if the chart timeframe is more than 1 day.
Lookback days are auto-capped to avoid exceeding TradingView’s 5000-bar limit.
The indicator automatically aligns intraday bars across multiple days to compute average deltas.
For better returns, it is recommended to use this indicator in conjunction with VWAP and a volatility-based position sizing mechanism.
Can be used as a reference for Open Range Breakout (ORB) strategies.
Customizations:
Toggle plotting of base levels and thresholds.
Toggle shading between thresholds.
Line colors and styles can be adjusted in the Style tab.
Author:
Gokul Ramachandran – software architect, engineer, programmer. Interested in trading and investment. Currently trading and researching strategies that can be employed in NSE (Indian market).
Contact: [gokul4trading@gmail.com](mailto:gokul4trading@gmail.com)
LinkedIn: linkedin.com/in/gokulramachandran/
Intended for educational and research purposes only.
Informacje o Wersji
This indicator implements the approach described in the research paper by Zarattini et al.Note: This implementation is designed for the NSE NIFTY50 index. While Zarattini’s original study was conducted on SPY, this version adapts the methodology for the Indian market.
Methodology Explanation
This indicator is primarily designed for Open Range Breakout (ORB) strategies.
Base Levels
- BaseUp = Maximum of today’s open and previous day’s close
- BaseDown = Minimum of today’s open and previous day’s close
Delta Calculation
- For the past 14 trading days (lookbackDays), the delta for each intraday candle is calculated as the ab
Average Delta
- For a given intraday time/candle today, deltaAvg is computed as the average of the deltas at the same time across the previous 14 days.
Threshold Bands
- ThresholdUp = BaseUp + deltaAvg
- ThresholdDown = BaseDown − deltaAvg
Signals
- Spot price moving above ThresholdUp → Long signal
- Spot price moving below ThresholdDown → Short signal
Tip: For better returns, combine this indicator with VWAP and a volatility-based position sizing mechanism.
Usage Notes
Internally, the indicator uses 2-minute candles if the selected chart timeframe is below 2 minutes.
Values may be inaccurate if the chart timeframe is not for intraday.
Designed for intraday trading on NIFTY50.
Author
Gokul Ramachandran – Software Architect, Engineer, Programmer
Interested in trading and investment
Actively researching and trading strategies for the Indian market (NSE)
Contact:
Email: gokul4trading@gmail.com
LinkedIn: linkedin.com/in/gokulramachandran/
Informacje o Wersji
Release Note – Fix BaseUp/BaseDown PersistenceUpdated calculation of BaseUp and BaseDown so they are fixed once per trading day and remain constant throughout all intraday bars of that session.
Previously, values could “snap” or drift with each new bar because they were recalculated continuously.
Now, the levels are initialized only on the first bar of a new day (using today’s open and previous day’s close) and then carried forward for the rest of the session.
This ensures consistent reference levels for thresholds and prevents intraday recalculation issues.
Skrypt open-source
W duchu TradingView twórca tego skryptu udostępnił go jako open-source, aby traderzy mogli analizować i weryfikować jego funkcjonalność. Brawo dla autora! Możesz korzystać z niego za darmo, ale pamiętaj, że ponowna publikacja kodu podlega naszym Zasadom Społeczności.
Wyłączenie odpowiedzialności
Informacje i publikacje przygotowane przez TradingView lub jego użytkowników, prezentowane na tej stronie, nie stanowią rekomendacji ani porad handlowych, inwestycyjnych i finansowych i nie powinny być w ten sposób traktowane ani wykorzystywane. Więcej informacji na ten temat znajdziesz w naszym Regulaminie.