OPEN-SOURCE SCRIPT
Zaktualizowano Pinks MultiRSI
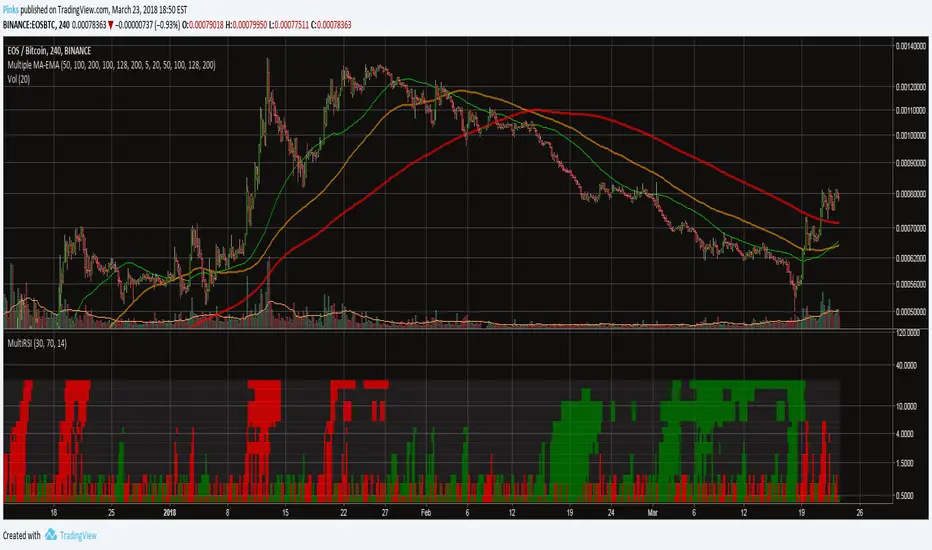
An indicator that displays whether RSI is oversold, undersold, or neutral, on several timeframes:
15m, 30m, 45m, 1h, 2h, 3h, 4h, 5h, 6h, 12h, 18h, 1D.
If RSI for a specific interval is overbought, the bars for that interval turn red (for "sell"). If it is oversold, it turns green (for "buy"). The RSI length, oversold level, and overbought level are tuneable.
The bottom row of coloumns is 15m RSI, top row is 1D RSI. It is recommended to use log scale on this indicator. The bar height is proportional to the interval it cover.
Informacje o Wersji
**NEW FEATURES**/b]You can now set multiple levels of overbought and oversold! The columns will be colored according to how oversold or overbought the RSI is. This will help you get a clearer image of the RSI on all timeframes.
Informacje o Wersji
Fixed bug where 5h RSI was set to 4h.Informacje o Wersji
Changed chart imageSkrypt open-source
W zgodzie z duchem TradingView twórca tego skryptu udostępnił go jako open-source, aby użytkownicy mogli przejrzeć i zweryfikować jego działanie. Ukłony dla autora. Korzystanie jest bezpłatne, jednak ponowna publikacja kodu podlega naszym Zasadom serwisu.
Wyłączenie odpowiedzialności
Informacje i publikacje nie stanowią i nie powinny być traktowane jako porady finansowe, inwestycyjne, tradingowe ani jakiekolwiek inne rekomendacje dostarczane lub zatwierdzone przez TradingView. Więcej informacji znajduje się w Warunkach użytkowania.
Skrypt open-source
W zgodzie z duchem TradingView twórca tego skryptu udostępnił go jako open-source, aby użytkownicy mogli przejrzeć i zweryfikować jego działanie. Ukłony dla autora. Korzystanie jest bezpłatne, jednak ponowna publikacja kodu podlega naszym Zasadom serwisu.
Wyłączenie odpowiedzialności
Informacje i publikacje nie stanowią i nie powinny być traktowane jako porady finansowe, inwestycyjne, tradingowe ani jakiekolwiek inne rekomendacje dostarczane lub zatwierdzone przez TradingView. Więcej informacji znajduje się w Warunkach użytkowania.