OPEN-SOURCE SCRIPT
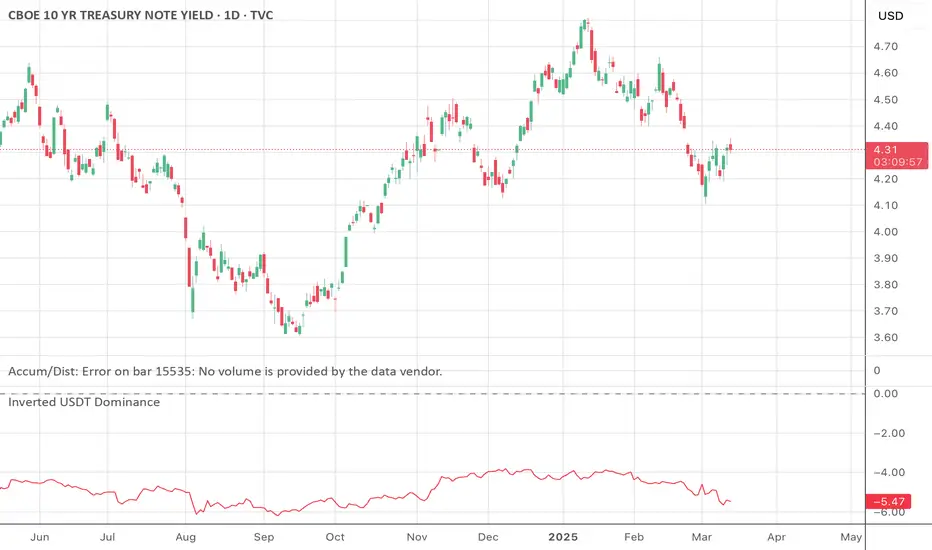
Inverted USDT Dominance

Inverted USDT Dominance Indicator
This simple yet powerful indicator plots the inverted USDT Dominance (USDT.D), making it visually intuitive to analyze market sentiment shifts. Typically, USDT dominance rises when investors seek stability, indicating a "risk-off" market environment. Conversely, it falls when investors pursue riskier assets like cryptocurrencies, signaling a "risk-on" environment.
Why invert the USDT Dominance chart?
By flipping USDT Dominance around the zero line, this indicator allows traders and investors to more clearly visualize its correlation and divergence with traditional market indicators like the 10-year Treasury yield (TNX), Bitcoin, or equity indices. A rising line on this inverted indicator intuitively indicates increasing market risk appetite, whereas a falling line highlights growing risk aversion.
Use cases:
Quickly visualize market sentiment (risk-on vs. risk-off).
Identify divergences and correlations between crypto markets and traditional financial instruments.
Enhance portfolio allocation decisions by clearly seeing sentiment changes.
Skrypt open-source
W zgodzie z duchem TradingView twórca tego skryptu udostępnił go jako open-source, aby użytkownicy mogli przejrzeć i zweryfikować jego działanie. Ukłony dla autora. Korzystanie jest bezpłatne, jednak ponowna publikacja kodu podlega naszym Zasadom serwisu.
Wyłączenie odpowiedzialności
Informacje i publikacje nie stanowią i nie powinny być traktowane jako porady finansowe, inwestycyjne, tradingowe ani jakiekolwiek inne rekomendacje dostarczane lub zatwierdzone przez TradingView. Więcej informacji znajduje się w Warunkach użytkowania.