OPEN-SOURCE SCRIPT
Bollinger Bands (with Width/GaUGE)
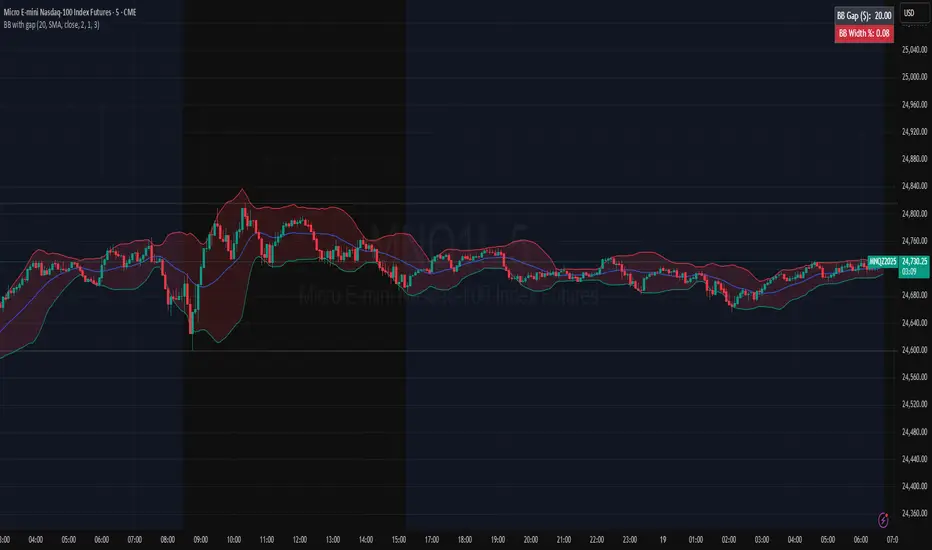
This overlay plots standard Bollinger Bands and makes volatility obvious. The fill between bands is color-coded by band width (tight = red “squeeze”, wide = teal “expansion”, mid = yellow). A compact table (top-right) shows live BB Gap ($) and BB Width (%), and the width also appears in the status line. Thresholds for squeeze/expansion are user-set. Use it to avoid low-volatility chop and time breakouts when width expands.
Skrypt open-source
W duchu TradingView twórca tego skryptu udostępnił go jako open-source, aby traderzy mogli analizować i weryfikować jego funkcjonalność. Brawo dla autora! Możesz korzystać z niego za darmo, ale pamiętaj, że ponowna publikacja kodu podlega naszym Zasadom Społeczności.
Wyłączenie odpowiedzialności
Informacje i publikacje przygotowane przez TradingView lub jego użytkowników, prezentowane na tej stronie, nie stanowią rekomendacji ani porad handlowych, inwestycyjnych i finansowych i nie powinny być w ten sposób traktowane ani wykorzystywane. Więcej informacji na ten temat znajdziesz w naszym Regulaminie.