OPEN-SOURCE SCRIPT
Current RSI vs Sector RSI Comparison
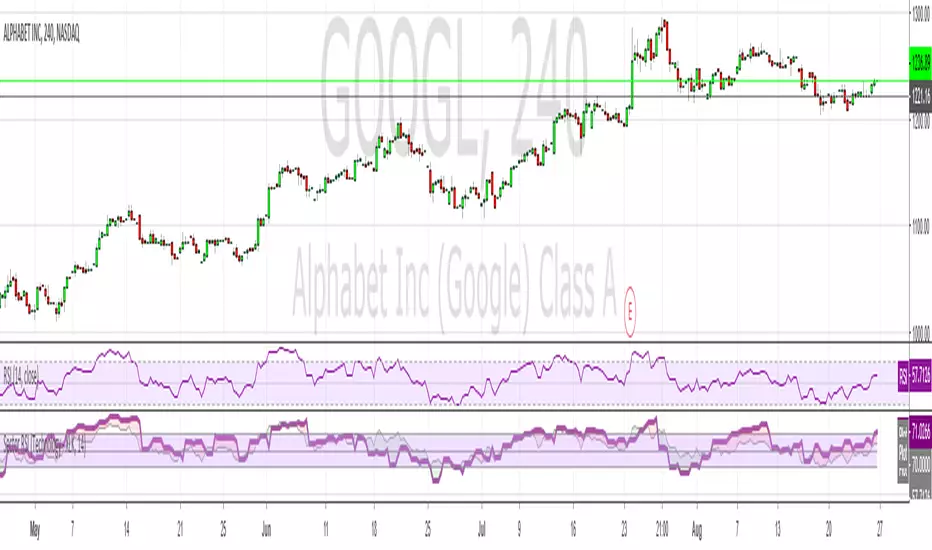
In the example above GOOGL's RSI is being compared against the RSI for XLK, the technology sector fund. The red and green areas make it easy to see if Google is under or overperforming relative to other tech stocks. I've included a normal RSI above it for comparison.
You can compare any stock to a sector, i.e. JP Morgan (JPM) versus the financial sector (XLF), or whatever your heart desires. All major sectors are selectable from a drop-down box and the output can also be visualised as a histogram too, much like a MACD.
You can compare any stock to a sector, i.e. JP Morgan (JPM) versus the financial sector (XLF), or whatever your heart desires. All major sectors are selectable from a drop-down box and the output can also be visualised as a histogram too, much like a MACD.
Skrypt open-source
W zgodzie z duchem TradingView twórca tego skryptu udostępnił go jako open-source, aby użytkownicy mogli przejrzeć i zweryfikować jego działanie. Ukłony dla autora. Korzystanie jest bezpłatne, jednak ponowna publikacja kodu podlega naszym Zasadom serwisu.
Wyłączenie odpowiedzialności
Informacje i publikacje nie stanowią i nie powinny być traktowane jako porady finansowe, inwestycyjne, tradingowe ani jakiekolwiek inne rekomendacje dostarczane lub zatwierdzone przez TradingView. Więcej informacji znajduje się w Warunkach użytkowania.