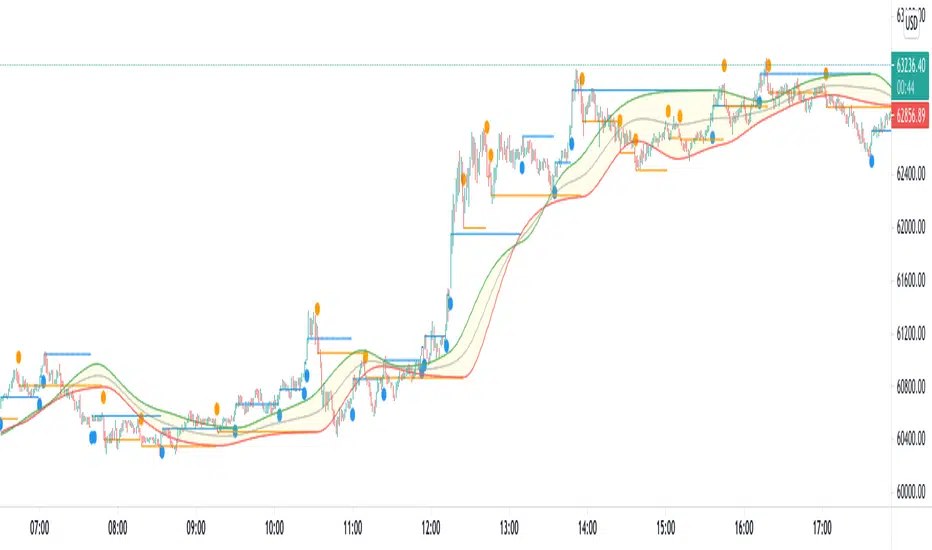
LinReg Triangular Fiffy

What this Script can help you with ?
1. It helps you figure out the Historical Breaks of the Linear Regression Channel { default length : 20, stdev : 2}, These historical breaks are plotted as Blue and Orange Dots
2. Also it plots the Level corresponding the Points where the historical breaks have happened as {blue and orange horizontal Lines}
3. It takes the historical Breaks of the LR Channel as Input to a triangular function which plots the trend based market bands in yellow
** The script have Provisions for Alerts
**** LinReg Breakout Bull
**** LinReg Breakdown Bear
How to Trade with the Script ?
First you will receive the alerts that there is a break of the linReg Band [wither bullish and bearish]
Then you look at the Triangula Yellow Bands, whether it is below the closing price or above it
If you receive a Bullish Signal and the Triangular Bands are below the closing price then you take long,
If you receive a Bearish Signal and the Triangular Bands are above the closing price then you take short,
If you receive a Bearish Signal and the Triangular Bands are below the closing price then you take short, till the upper band, {for begginers, its noTrade situation}
If you receive a Bullish Signal and the Triangular Bands are above the closing price then you take Long, till the Lower band, {for begginers, its noTrade situation}
How to get access ?
Just private message me, I will be happy to share u guys!
Skrypt tylko na zaproszenie
Dostęp do tego skryptu mają wyłącznie użytkownicy zatwierdzeni przez autora. Aby z niego korzystać, należy poprosić o zgodę i ją uzyskać. Zgoda jest zazwyczaj udzielana po dokonaniu płatności. Więcej informacji można znaleźć w instrukcjach autora poniżej lub kontaktując się bezpośrednio z Ankit_1618.
TradingView NIE zaleca płacenia za skrypt ani korzystania z niego, jeśli nie ma pełnego zaufania do jego autora i nie rozumie się zasad jego działania. Można również znaleźć darmowe, otwartoźródłowe alternatywy w skryptach społeczności.
Instrukcje autora
→ ocstrader.com
About me
AlgoTrading Certification, ( University of Oxford, Säid Business School )
PGP Research Analysis, ( NISM, SEBI )
Electronics Engineer
Wyłączenie odpowiedzialności
Skrypt tylko na zaproszenie
Dostęp do tego skryptu mają wyłącznie użytkownicy zatwierdzeni przez autora. Aby z niego korzystać, należy poprosić o zgodę i ją uzyskać. Zgoda jest zazwyczaj udzielana po dokonaniu płatności. Więcej informacji można znaleźć w instrukcjach autora poniżej lub kontaktując się bezpośrednio z Ankit_1618.
TradingView NIE zaleca płacenia za skrypt ani korzystania z niego, jeśli nie ma pełnego zaufania do jego autora i nie rozumie się zasad jego działania. Można również znaleźć darmowe, otwartoźródłowe alternatywy w skryptach społeczności.
Instrukcje autora
→ ocstrader.com
About me
AlgoTrading Certification, ( University of Oxford, Säid Business School )
PGP Research Analysis, ( NISM, SEBI )
Electronics Engineer